Fig. 1.
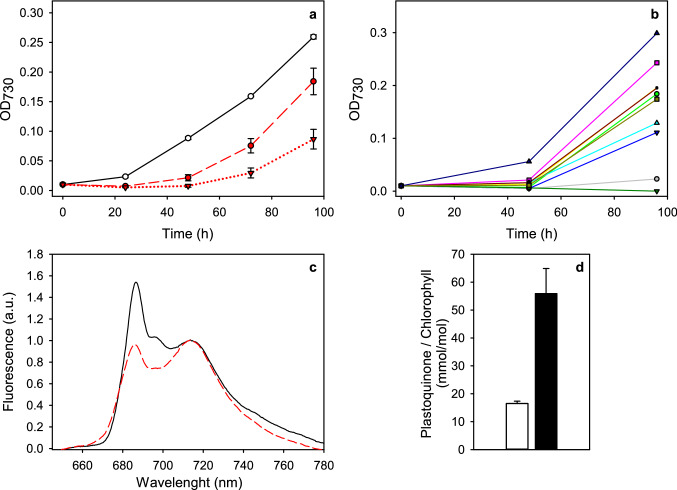
a Growth of cultures of C. reinhardtii strain cc124 in control conditions (open circles, solid line) and two types of cultures in EL: isolated subpopulations (red circles, red dashed line) and single-cell-originating inocula (red triangles, red dotted line). b the growth of individual, EL-categorized, single-cell-originating cultures, after being cultured in moderate PPFD of 100 µmol m−2 s−1 for 1 week after initial EL acclimation. The growth of the cultures was determined spectrophotometrically as increase in optical density at 730 nm. The inoculum density was 0.01, after which the cultures were kept for 96 h in the light conditions described. The cells were grown in 45 ml of photoautotrophic medium at room temperature and ambient atmosphere on a shaker. The curves in a are averaged from 3 (control) or 30 (EL cultures) independent biological replicates and the error bars show SEM. The curves in b represent observations from individual cultures. c Fluorescence emission spectrum of control (solid, black line) and EL cells (dashed, red line) measured at 77 K. The samples taken directly from growth conditions were stored at − 80 °C and diluted to 1.5 µg Chl ml−1 and final volume 50 µl upon measurement. Fluorescence was measured with QEPro spectrometer with 442 nm excitation. The data were normalized to the value at 713 nm. d Total amount of PQ in control (white bar) and EL (black bar) cells, normalized to Chl concentration. The total amount of PQ was measured with a HPLC method (Khorobrykh et al. 2020) from cultures that had reached the end of exponential growth phase; the Chl concentrations for the normalization were measured spectrophotometrically from methanol extracts of the cultures. All the data in c and d are averaged from three independent biological replicates and the error bars show SD

