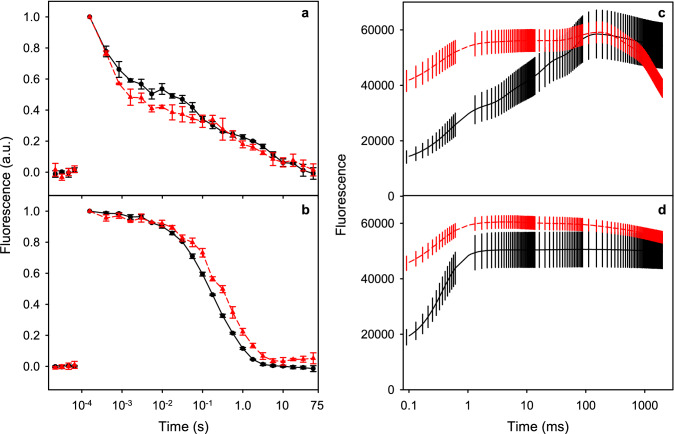
Fig. 5.
Decay of Chl a fluorescence yield after a single turnover flash (a, b) and fluorescence signal of Chl a fluorescence induction (c, d) measured in the absence (a, c) and presence (b, d) of DCMU from control (black, solid lines) and EL (red, dashed lines) C. reinhardtii cells in ambient air. Fluorescence measurements were conducted with 2 ml samples of cells containing either 5 µg Chl ml−1 (fluorescence decay, panels a, b) or 1 µg Chl ml−1 (fluorescence induction, panels c, d). The samples were dark-incubated for 15 min before measurement. The values in a, b are double normalized, first to the zero fluorescence level, measured before the flash, and then to the maximum fluorescence after the single turnover flash given at t = 1 ms. Fluorescence induction (c, d) was induced with blue, 455 nm actinic light with PPFD 400 µmol m−2 s−1. All curves are averaged from three independent biological replicates and the error bars show SD

