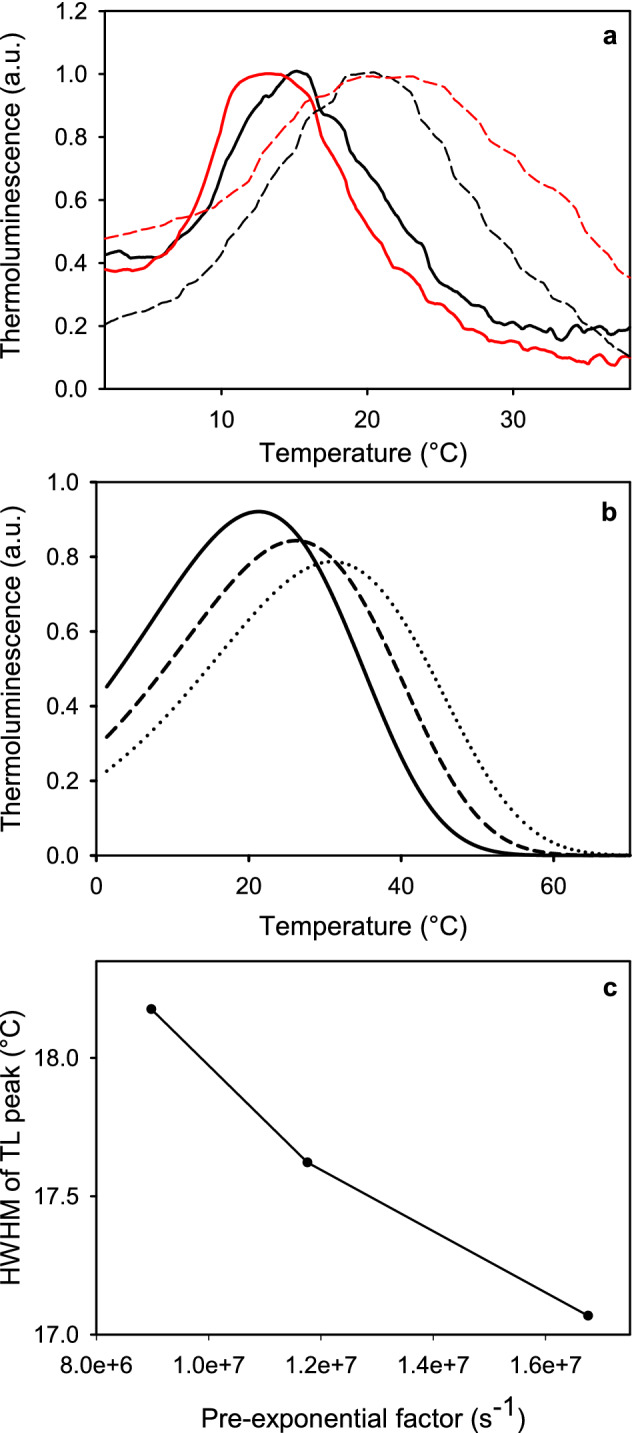
Fig. 6.

a Thermoluminescence Q band (solid line) and B band (dashed line) measured from control (black) and EL (red) cultures of C. reinhardtii. 200 µl samples, containing 3.1 µg of Chl, were cooled down to either − 20 °C (for Q band measurements) or − 10 °C (B band measurements) and then charged with a single turnover flash. The temperature was then gradually increased up to 60 °C at a heating rate of 0.66 °C s−1. The Q bands were recorded in the presence of 20 µM DCMU. All bands are averaged from three biological replicates. b Simulated thermoluminescence curves assuming a first-order reaction with Ea = 501 eV, heating rate 0.66 °C s−1 and pre-exponential factor of Arrhenius’ equation of 1.7 × 10⁷ s−1 (solid line), 1.2 × 10⁷ s−1 (dashed line) or 9 × 10⁶ s−1 (dotted line) and c the half width at half maximum of the thermoluminescence band as a function of the pre-exponential factor
