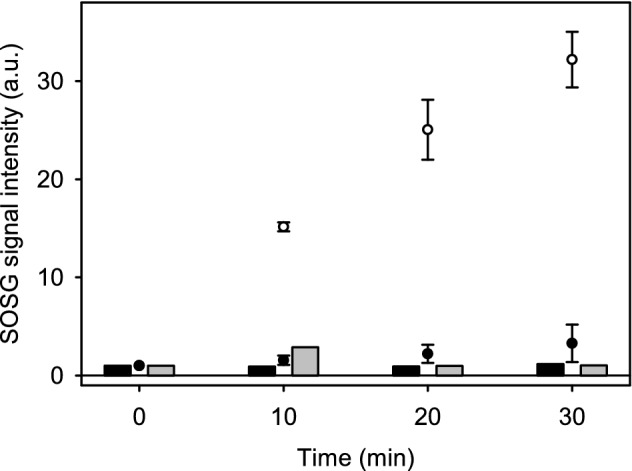
Fig. 7.

1O2 production, measured as increase of fluorescence emitted by endoperoxidized SOSG, of control (open circles) and EL cells (black circles) in comparison to light controls illuminated without SOSG (grey bars) and dark controls (black bars) incubated in the dark with SOSG. 350 µl samples containing 50 µg ml−1 Chl were supplemented with 50 µM SOSG and then treated with red light (> 650 nm) with PPFD 2000 µmol m−2 s−1. The fluorescence emitted by SOSG that had reacted with 1O2 was excited with 500 nm light and recorded spectrophotometrically at 535–540 nm. Each data point represents an average of three biological replicates and the error bars show SD
