Figure 2.

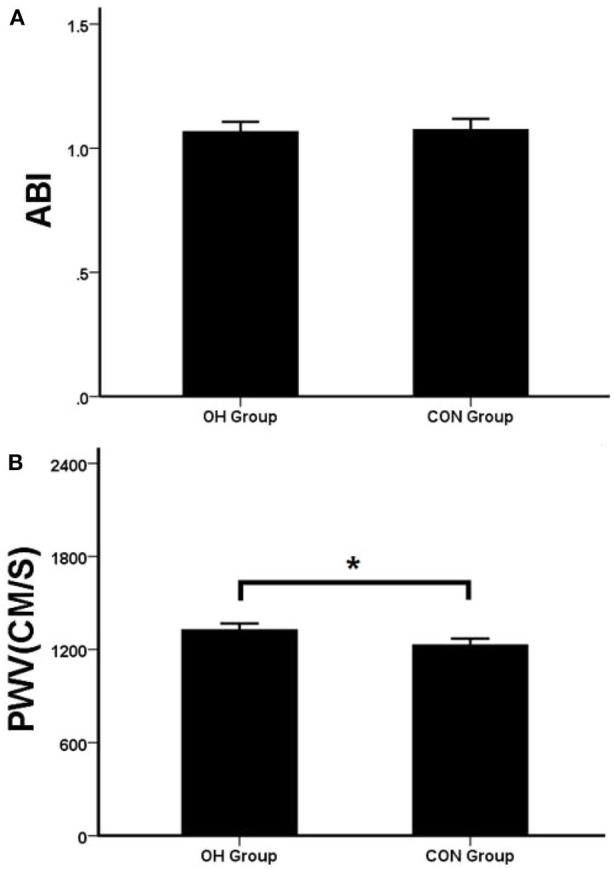
(A) The two groups of ABI. (B) The two groups of PWV. OH, orthostatic hypotension group; CON, control group. *P < 0.05, statistical difference.

(A) The two groups of ABI. (B) The two groups of PWV. OH, orthostatic hypotension group; CON, control group. *P < 0.05, statistical difference.