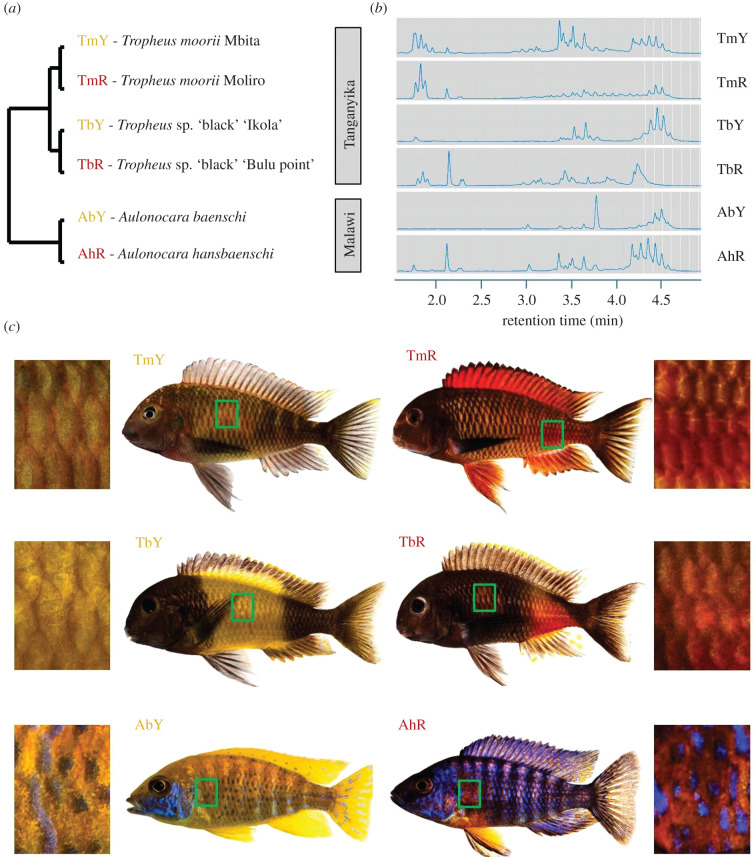
Figure 1.
Cichlid taxa and skin regions analysed in the present study. (a) Schematic illustration of the phylogenetic relationships between the investigated cichlid taxa. (b) Ultra‐high‐performance liquid chromatography (UHPLC) chromatograms of carotenoid extracts of one typical skin sample per colour variant. Peaks after 2.5 min correspond to esterified carotenoids (except for free beta carotene at 3.8 min in A. baenschi). For a larger view, see electronic supplementary material, figure S1. (c) The skin regions sampled for paired comparisons between cichlid colour variants are marked by green boxes on the fish bodies and depicted in macroscopic photographs. Taxon codes as shown in (a).

