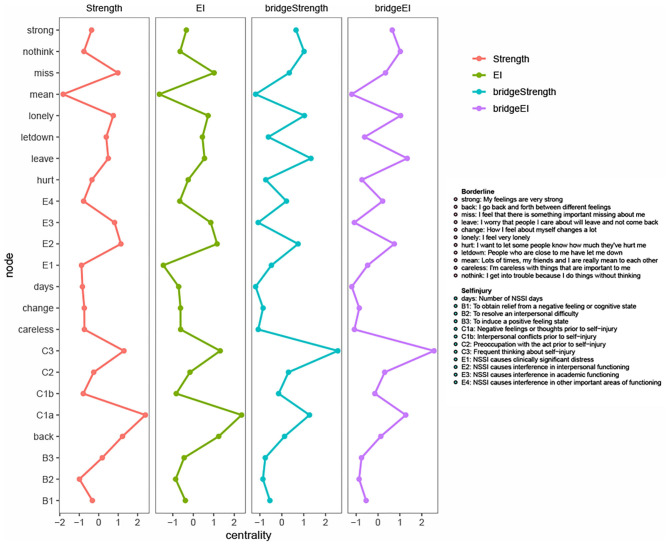
Figure 3.
(Bridge) strength and (bridge) expected influence. Centrality measures are visualized using standardized values to facilitate comparison. The x-axis represents standardized centrality values, the y-axis represents each node. The full definition of each node can be found in the legend. EI, expected influence.

