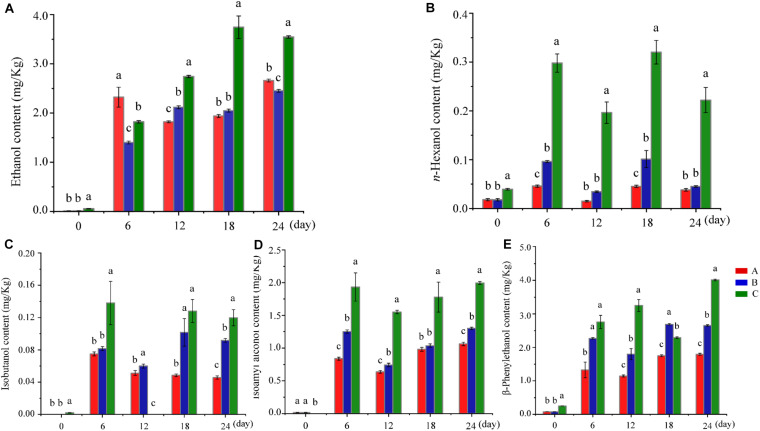
FIGURE 1.
Changes in ethanol and higher alcohols in different groups during fermentation. (A–E) Shows the ethanol content, n-hexanol content, isobutanol content, isoamyl alcohol content, and β-phenylethanol content at various fermentation stages in different groups, respectively. Different letters indicate significant differences (P < 0.05). Red bar, blue bar and green bar represents Group A, B and C, respectively.

