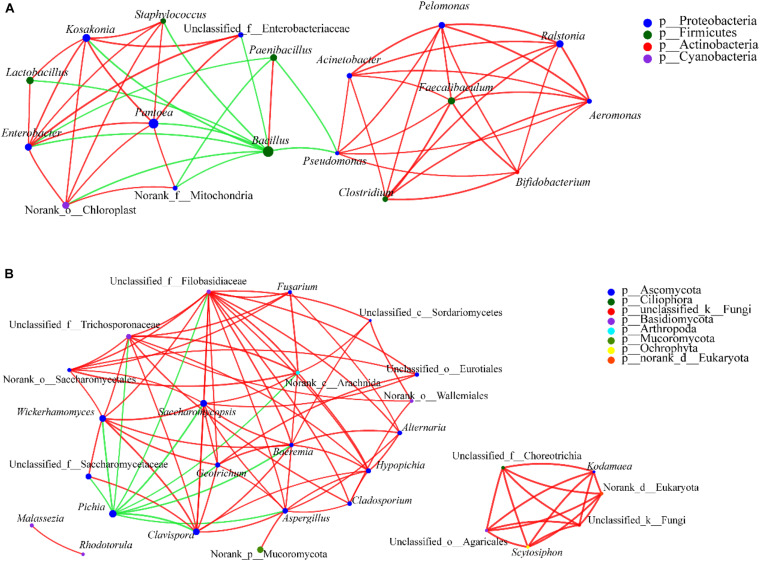
FIGURE 10.
Correlation network of co-occurring genera in dominant microbiota. Statistical significance (P < 0.05) and Spearman correlation coefficient (| ρ| < 0.5) indicate the correlations. Green and red lines indicate negative and positive interactions, respectively, between genera. The thickness of the lines represents the strength of interaction. Size of each node is proportional to the number of connections, the nodes with the same color can be affiliated to the same phylum. The thickness of edge is proportional to the absolute value of Spearman’s correlation coefficients. (A) For prokaryotic microbiota and (B) for eukaryotic microbiota.

