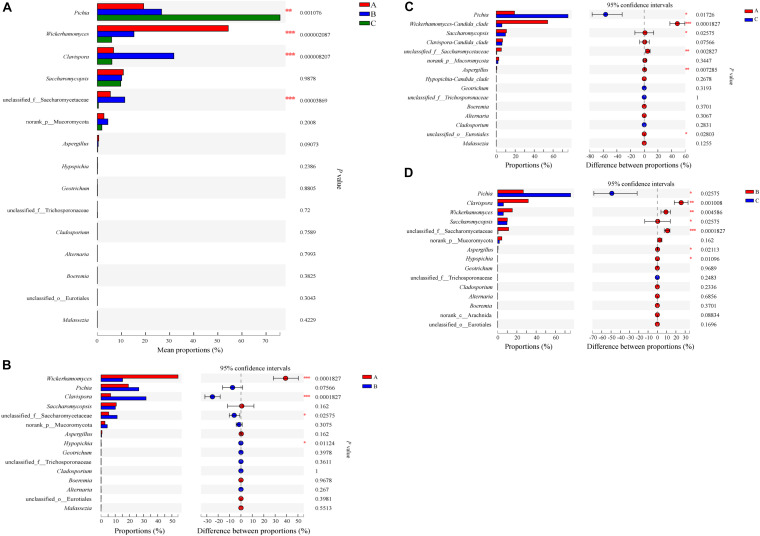
FIGURE 11.
Relative abundances of eukaryotic microbiota that showed significant differences among three groups at genus level. Data of groups were showed as relative abundance of genus in each group. (A) A one-way ANOVA was used to evaluate the significance of differences among three groups; (B–D) showed that phylotypes significantly different between Groups A and B, Groups A and C, and Groups B and C, respectively, at genus level, and statistical analysis was performed by the Wilcoxon rank-sum test. Asterisk shows significant differences (“*”, 0.01 < P < 0.05; “**”, 0.001 < P < 0.01; “***”, P < 0.001).

