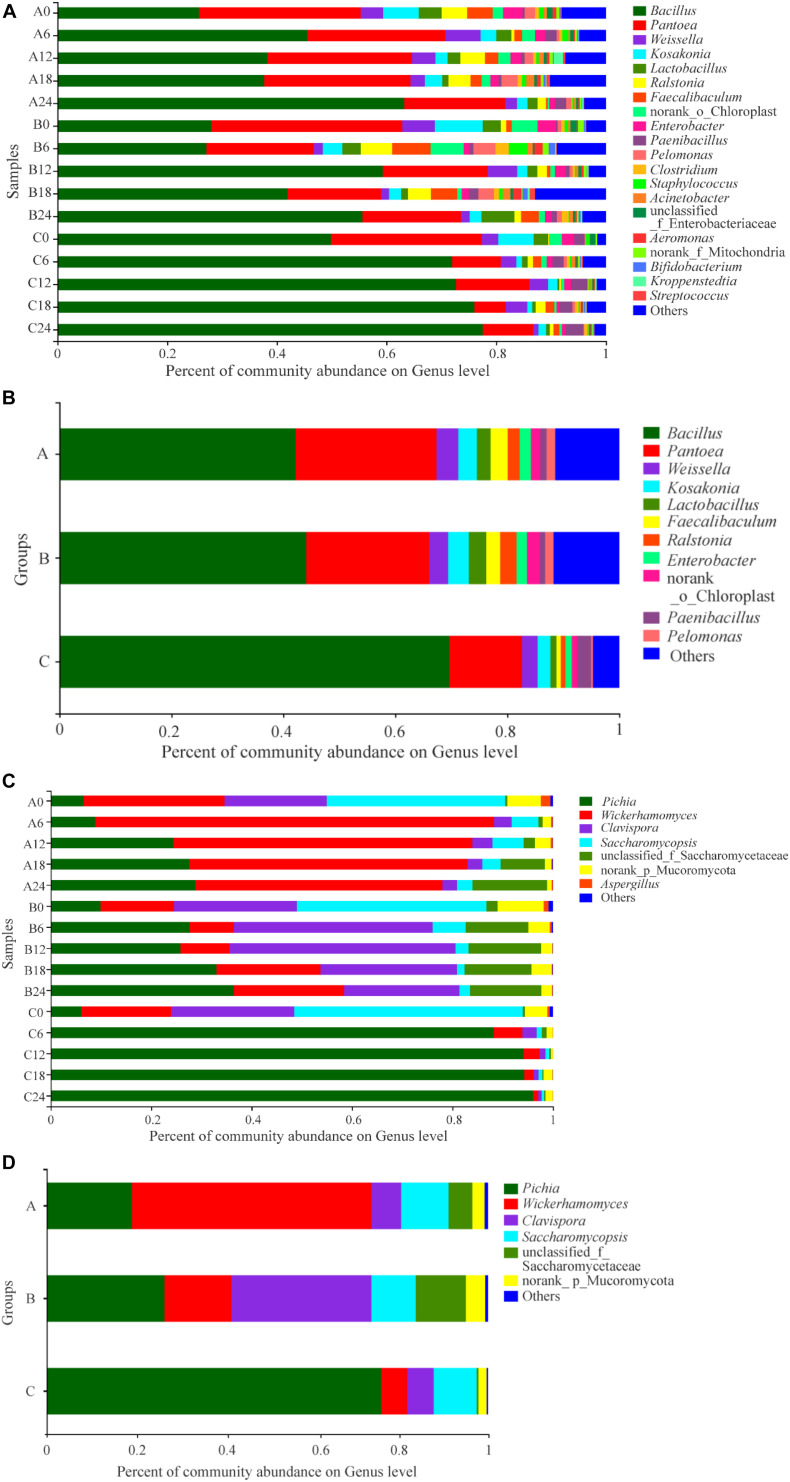
FIGURE 4.
Distribution of the relative abundances of prokaryotic (A,B) and eukaryotic (C,D) microbiota at the genus level. The relative abundance defines sequence percentages in samples as depicted by the colors in the bar chart. Only those genus that had an average abundance greater than 1% are indicated, genus with less than 1% abundance are combined and shown in “others” category. Analysis of prokaryotic microbiota composition in different groups during fermentation are shown in (A,B). Results of eukaryotic microbiota in different groups at the genus level are shown in (C,D). The samples taken from different experimental groups at different days were labeled as a combination of corresponding groups and days.

