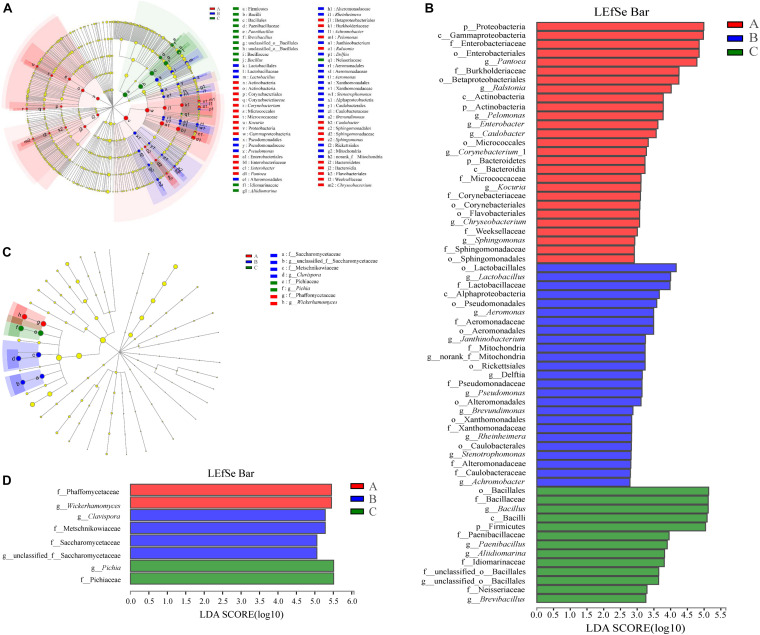
FIGURE 6.
Prokaryotic (A,B) and eukaryotic (C,D) microbiota difference identification in three groups. (A,C) Taxonomic representation of statistically and biologically consistent differences among three groups with different treatments. Differences are represented by the color of the most abundant class (red, Group A; blue, Group B; green, Group C; yellow, non-significant). Circles indicate phylogenetic levels from phylum to genus. The diameter of each circle is proportional to the abundance of the group. (B,D) Linear discriminant analysis score, used to build the cladogram among three groups. Histogram of the LDA scores for indicator prokaryotic microbiota with LDA scores of 2 or greater in prokaryotic communities. LDA scores were calculated by LDA effect size, using the linear discriminant analysis to assess effect size of each differentially prokaryotic taxa (red, Group A; blue, Group B; green, Group C). The cladogram is displayed according to effect size.

