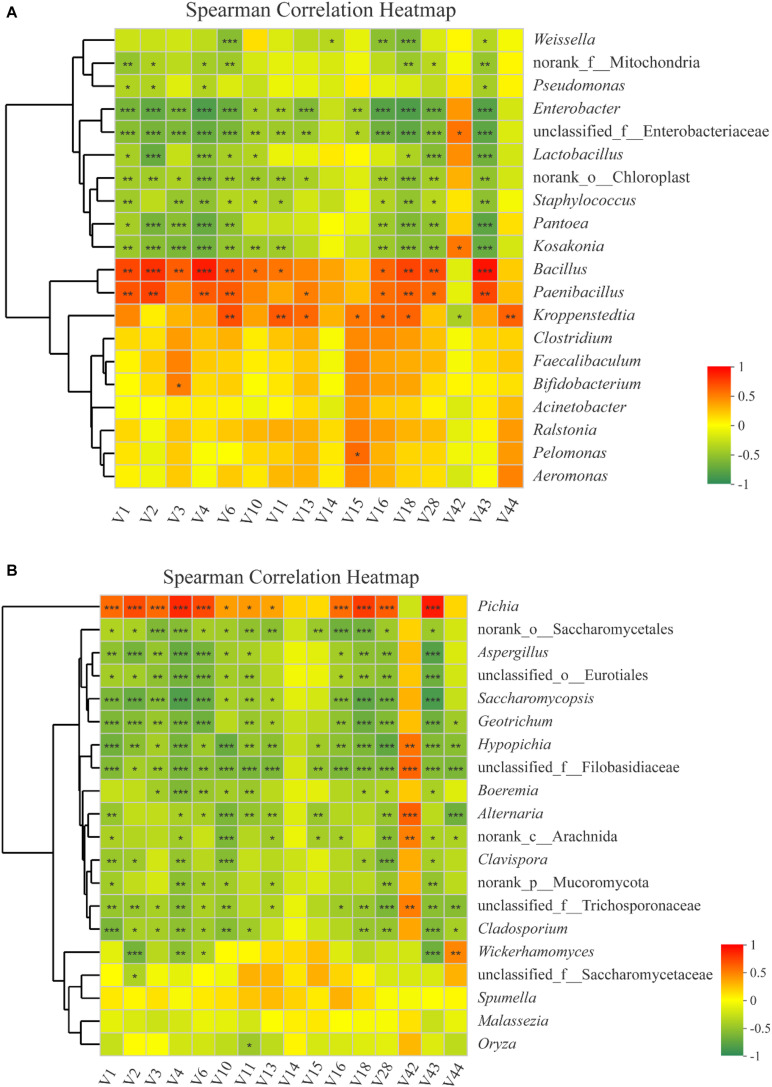
FIGURE 9.
Correlation between partial flavor compounds (V1–V44: the codes of different flavor compounds in Supplementary Table S1) and prokaryotic microbiota (A) and eukaryotic microbiota (B). Scale bar colors denote the nature of the correlation, with 1 indicating a perfectly positive correlation (red) and –1 indicating a perfectly negative correlation (green) between flavor compounds and prokaryotic microbiota or eukaryotic microbiota. Asterisk shows significant correlations (“*”, 0.01 < P < 0.05; “**”, 0.001 < P < 0.01; “***”, P < 0.001), and NA shows no correlations.

