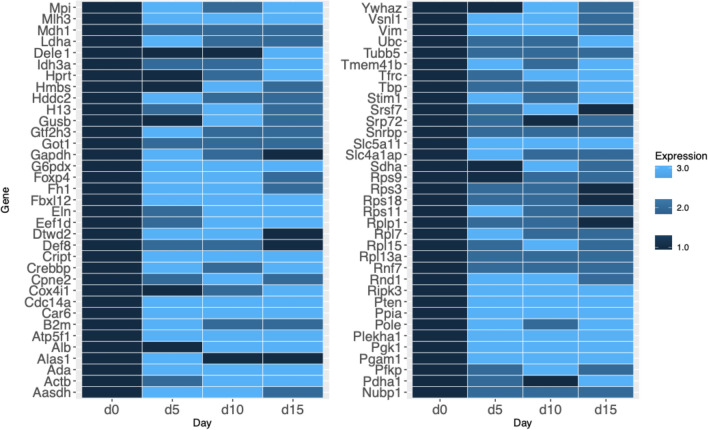
Figure 3.
A heatmap representing fold changes in the housekeeping genes’ expressions throughout the iPS reprogramming process. The genes are grouped by fold-expression change into one of three groups, represented by dark blue, medium blue and light blue. Four time points during the reprogramming are indicated under the heatmaps, and the gene names are written on the left. The dark blue color represents no expression change, and Day 0 is taken as the “time point zero” before initiation of reprogramming. The medium blue color represents the expression change of more than statistically significant 1.5-fold, but less than threefold. Light blue represents gene expression change greater than threefold, compared to time point zero (Day 0).

