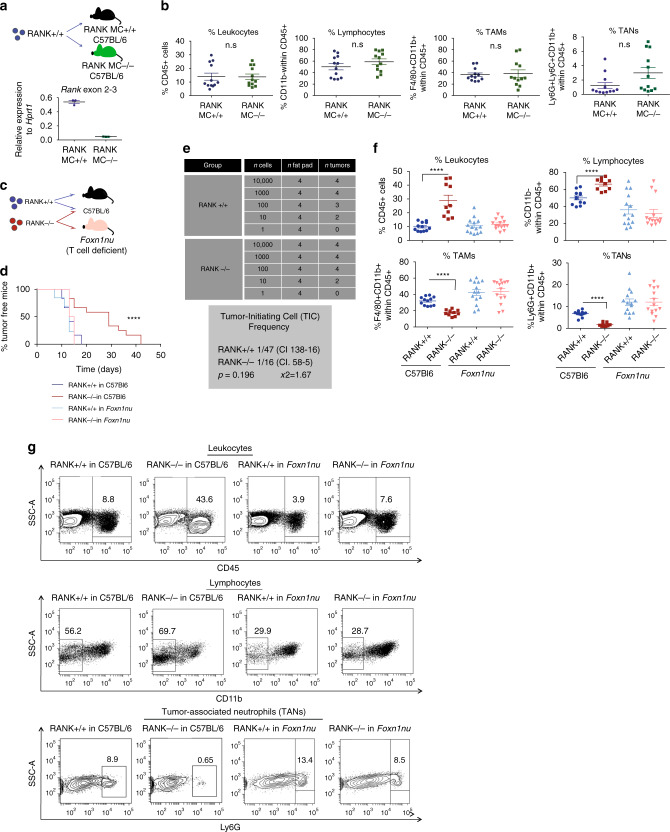
Fig. 1. Loss of RANK in tumor cells, but not in myeloid cells, leads to increased TIL frequency, and T cells drive the delayed tumor formation and the reduced tumor-initiating ability of RANK-null tumor cells.
a Top panel: injection scheme showing the implantation of PyMT RANK+/+ (RANK+/+) tumors in LysM-Cre RANKfl/fl mice (RANK MC−/−) and WT (RANK MC+/+) (C57BL/6). Bottom panel: Rank mRNA expression levels relative to Hprt1 in peritoneal macrophages of RANK MC−/− and RANK MC+/+ mice (n = 3). Mean ± SEM is shown. b Graphs showing the percentages of tumor-infiltrating leukocytes (CD45+), lymphocytes (CD11b− within CD45+), tumor-associated macrophages (TAMs) (F4/80+CD11b+ within CD45+) and tumor-associated neutrophils (TANs) (Ly6G+Ly6C−CD11b+ within CD45+) in RANK+/+ tumor transplants in RANK MC−/− and RANK MC+/+ mice (n = 12 tumors). Mean, SEM shown. t-test and p-values were calculated. c Injection scheme showing the implantation of PyMT RANK+/+ and PyMT RANK−/− tumors in C57BL/6 WT animals and Foxn1nu mice. d Kinetics of palpable tumor onset (left) after tumor transplantation of RANK+/+ and RANK−/− tumor cells in syngeneic C57BL/6 (n = 6) and Foxn1nu mice (n = 7). Log-rank test performed with two-tailed p-value (****p = 0.005). One representative experiment out of two is shown. e Tumor-initiating frequencies as calculated by ELDA. Cells isolated from RANK+/+ and RANK−/− tumors were injected in Foxn1nu mice in limiting dilutions. WEHI’s online ELDA-software (http://bioinf.wehi.edu.au/software/elda/) was used to calculate the χ2-values with 95% confidence interval. f Graphs showing the percentages tumor-infiltrating leukocytes (CD45+; ****p < 0.0001), lymphocytes (CD11b− within CD45+; ****p < 0.0001), TAMs (F4/80+CD11b+ within CD45+; ****p < 0.0001), TANs (Ly6G+CD11b+ within CD45+; ****p < 0.0001) in RANK+/+ or RANK−/− tumor transplants in syngeneic C57BL/6 and Foxn1nu mice (n = 12 RANK+/+ tumors, n = 10 RANK−/− tumors in C57BL/6 hosts; n = 14 RANK+/+ or RANK−/− tumors in Foxn1nu hosts). Tumors were analyzed at endpoint (>0.2 cm2). Mean, SEM and t-test two-tailed p-values are shown. Two representative primary tumors were used in these experiments. g Representative dot blots of leukocytes (CD45+) gated in live cells (7AAD−) and lymphocytes (CD11b−) gated on CD45+.

