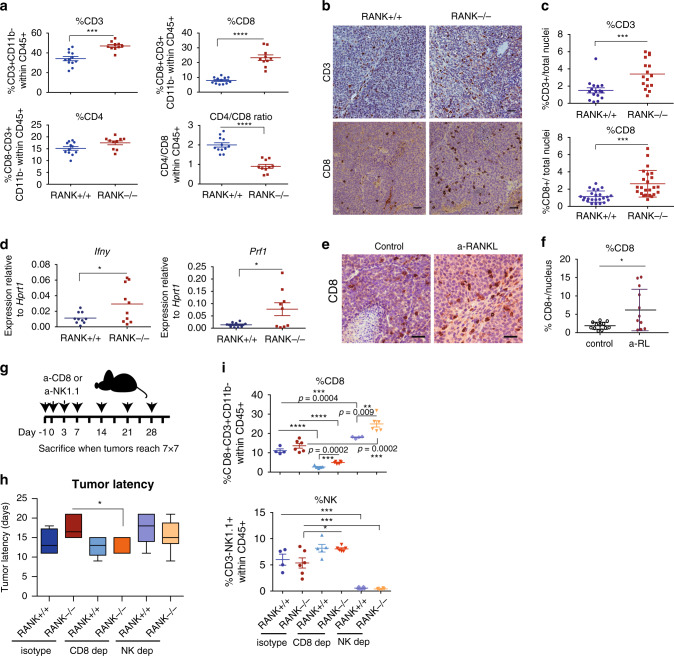
Fig. 2. RANK loss in tumor cells leads to increased CD8+ Tcell tumor infiltration that mediates the delayed tumor latency of RANK−/− tumors.
a Graphs showing the percentage of T cells (CD3+CD11b− within CD45+; ***p = 0.0001), CD8 (CD8+CD3+CD11b− within CD45+; ****p < 0.0001), CD4 (CD8-CD3+CD11b− within CD45+; p = 0.0503), and the CD4/CD8 ratio (****p < 0.0001) in RANK+/+ (n = 12) or RANK−/− (n = 10) tumor cells injected in syngeneic C57BL/6 mice#. Representative images (b) and quantification (c) of CD3+ (n = 4 tumors, ***p = 0.0009) and CD8+ cells (n = 6 tumors, ***p = 0.0001) in RANK+/+ and RANK−/− tumor transplants as assessed by IHC. Scale = 25 μm. Tumors derived from three independent primary tumors were used. Each dot represents one picture#. d Prf1 and Ifnγ mRNA levels relative to Hprt1 of whole tumors from RANK+/+ and RANK−/− transplants in syngeneic C57BL/6 mice (n = 10; Prf1 *p = 0.0286, Ifnγ *p = 0.0360)#. e, f Representative images (e) and quantification (f) of CD8+ cells in RANK+/+ control and anti-RANKL-treated tumors from second transplants as assessed by IHC. Scale = 25 μm. Each dot represents one picture (n = 12 pictures, n = 3 tumors, *p = 0.0168)#. g Schematic overview of CD8 (300 μg, clone 53-5.8) and NK1.1 (200 μg, clone PK136) treatments in orthotopic RANK+/+ and RANK−/− tumor transplants. Animals were treated i.p. on days −1, 0, 3, and 7 after tumor cell injection and then once per week until the day of killing, when tumors were >0.5 cm2. h Latency to tumor onset of RANK+/+ and RANK−/− tumor cells implanted in syngeneic C57BL/6 animals and treated with anti-CD8 or anti-NK1.1 depletion antibodies (n = 6) or corresponding isotype control (n = 4 for RANK+/+ and n = 6 for RANK−/−). Box and whisker plots (box represents the median and the 25th and 75th percentiles, whiskers show the largest and smallest values) and significant t-test two-tailed p-values are shown (*p = 0.05). i Graphs showing the percentage of infiltrating CD8 T cells (CD8+CD3+CD11b− within CD45+) and NK (NK1.1+CD3− within CD45+). Each dot represents one tumor (n = 4 control and NK-depleted RANK+/+ tumors; n = 5 CD8-depleted RANK+/+ tumors; and n = 6 RANK−/− control, NK- and CD8-depleted tumors)#. #Mean, SEM and t-test two-tailed p-values are shown (*p < 0.05; **0.001 < p < 0.01; ***0.001 < p < 0.0001; ****p < 0.0001). For a and d, each dot represents one tumor analyzed at the endpoint (>0.2 cm2). Data for tumor transplants derived from two representative primary tumors in two independent experiments.

