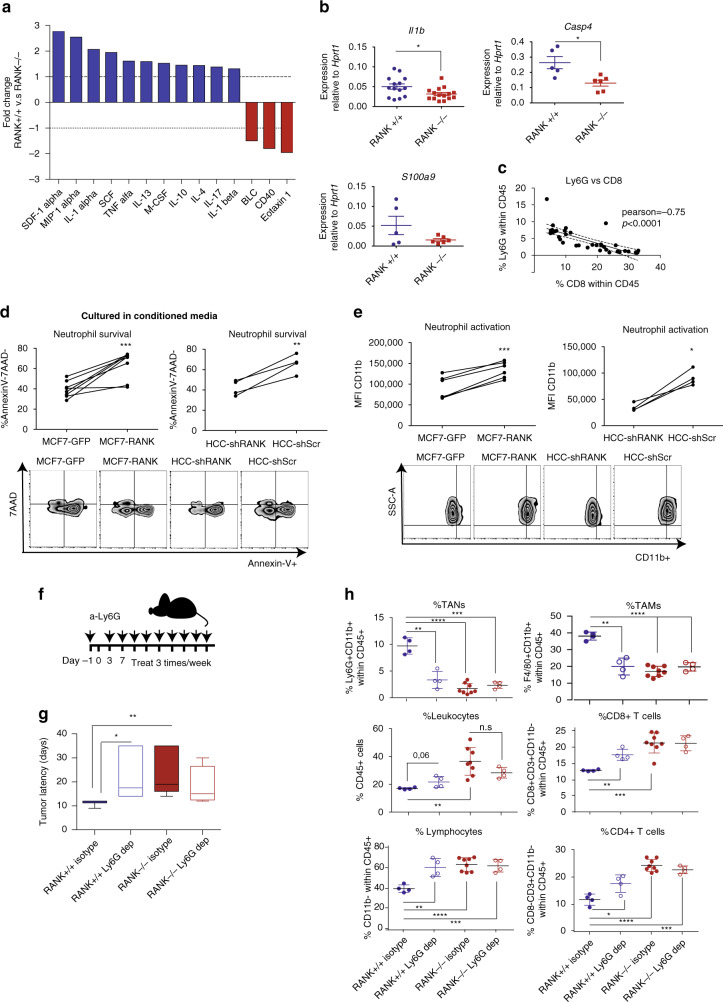
Fig. 3. Neutrophils recruited by the proinflammatory cytokine/chemokine milieu driven by RANK restrict T-cell immunity.
a Cytokines/chemokines in the supernatant of RANK+/+ and RANK−/− tumor 3D acini cultured during 72 h, expressed as the magnitude of change between RANK+/+ and RANK−/− tumor acini (pool of 3 tumors, n = 1). See also Supplementary Data 5. b Il1b, Casp4, and S100a9 mRNA levels relative to Hprt1 of whole tumors from RANK+/+ and RANK−/− transplants in syngeneic C57BL/6 mice (n = 14 for Il1b, *p = 0.005; n = 5 RANK+/+ tumors, n = 6 RANK−/− tumors for Casp4, p = 0.011; and S100a9, p = 0.12). Two representative primary tumors of two independent experiments were used#. c Correlation between the frequency of TANs (Ly6G+ Ly6C+ CD11b+) and CD8+-T cells (CD8+ CD3+ CD11b−) infiltrates in tumor transplants. Pearson’s correlation coefficients (r) associated probabilities are shown (p < 0.0001). d Percentage of Annexin V–7AAD− neutrophils (n = 5, 2 healthy donors) cultured with conditioned media (CM) from the indicated RL-treated tumor cells. CM was added (1 : 1) to human neutrophil cultures for 24 h. Paired t-test with one-tailed p-value is shown (***p = 0.0002, **p = 0.009). e Mean fluorescence intensity (MFI) of CD11b+ neutrophils (n = 4, 2 healthy donors) cultured in CM from the indicated RL-treated tumor cells. CM was added (1 : 1) to human neutrophils cultures for 24 h. Paired t-test with one-tailed p-value is shown (***p = 0.0004, *p = 0.01). f Schematic overview of TAN (Ly6G+) depletion experiments in orthotopic RANK+/+ and RANK−/− tumor transplants. Anti-Ly6G (clone 1A8) was administered i.p. before tumor cell injection (400 µg) and then once per week (100 μg) until the day of killing. g Latency to tumor formation of RANK+/+ and RANK−/− tumor cells orthotopically implanted in syngeneic C57BL/6 animals and treated with anti-Ly6G depletion antibody or isotype control (n = 4 control and neutrophil-depleted RANK+/+ tumors, n = 8 control RANK−/− tumors, n = 4 neutrophil-depleted RANK−/− tumors). Box and whisker plots (box represents the median and the 25th and 75th percentiles, whiskers show the largest and smallest values) and t-test two-tailed p-values are shown. (*p = 0.028; **p = 0.007). h Graphs showing the percentage of TANs (Ly6G+ CD11b+, **p = 0.0012; ***p = 0.0003; ****p < 0.0001), leukocytes (CD45+; **p = 0.034), lymphocytes (CD11b−; **p = 0.048; ***p = 0.0008; ****p < 0.0001), TAMs (F4/80+ CD11b+, **p = 0.0019; ****p < 0.0001), CD8+ T cells (CD8+ CD3+ CD11b−, ***p = 0.0003, **p = 0.0014), and CD4+ T cells (CD8− CD3+ CD11b−, *p = 0.0213, ***p = 0.001; ****p < 0.0001) (n = 4 control and neutrophil-depleted RANK+/+ tumors, n = 8 control RANK−/− tumors, n = 4 neutrophil-depleted RANK−/− tumors)#. #Each dot represents one tumor. Mean, SEM, and t-test two-tailed p-values are shown (*p < 0.05; **p < 0.01; ***p < 0.001; ****p < 00001). Tumors of similar size were analyzed at endpoint (>0.2 cm2). For d, e, each dot represents a technical replicate from healthy donors. Representative dot blots are shown below.

