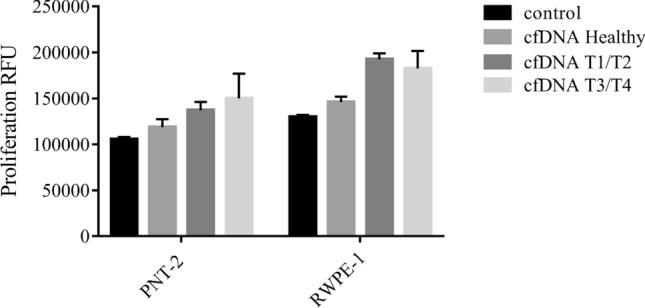
Figure 6.

Evaluation of the influence of cfDNA treatment on proliferation. PNT-2 and RWPE-1 cell lines were treated with cfDNA healthy, cfDNA T1/T2, and cfDNA T3/T4. Twenty nanograms of cfDNA were incubated with 1 × 10⁴ cells for 24 h. The proliferation was measured by relative fluorescence units. Data are expressed as the mean ± SEM of at least three independent experiments. No statistical differences were observed (*p < 0. 05; Kruskal–Wallis test).
