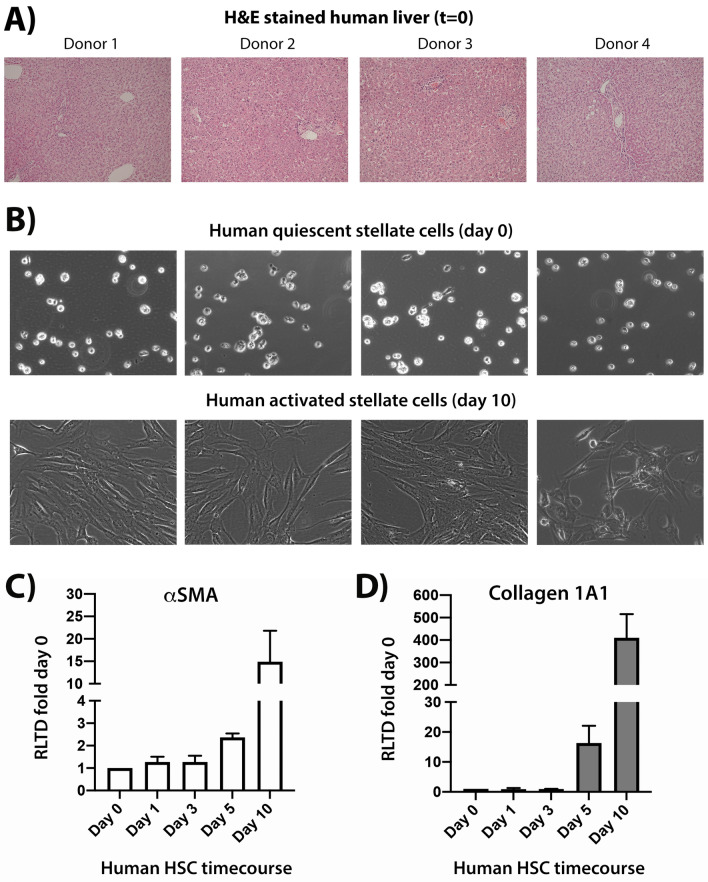
Figure 1.
Human HSC isolated from normal human livers and timecourse of their in vitro activation. (A) Representative brightfield H&E stained images of four human donor livers used in the study, which depict normal tissue structure and architecture at X10 magnification. (B) Representative brightfield images of four human HSC preps used in the study showing quiescent HSC in top panel and fully activated HSC in the bottom panel. (C) Quantitative PCR carried out on time-course cDNA isolated from of human HSC preps used in the study showing αSMA transcript levels in (C) and Collagen1A1 in (D).

