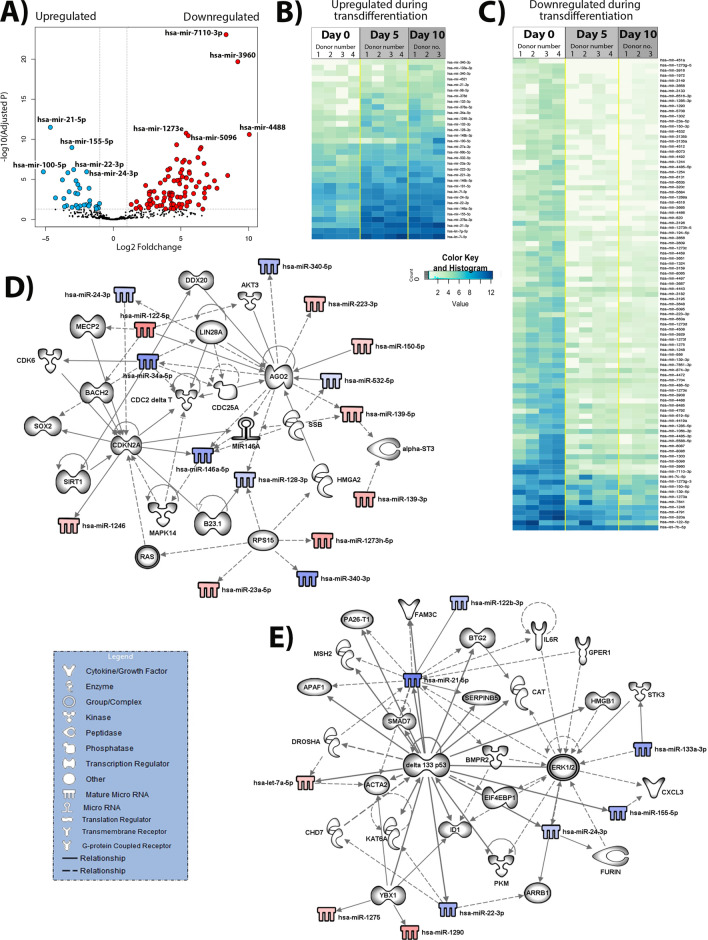
Figure 3.
Differential expression of human HSC activation during the perpetuation stage. (A) Volcano plot of the comparison between the freshly isolated, quiescent HSC (day 0, n = 4) and fully activated HSC (day 10, n = 3). In blue—differentially under-expressed miRNA in day 0; in red—differently over-expressed miRNA in day 0 (p-adjusted < 0.05 and foldchange > 1). (B) Heatmap of the 32 significant under-expressed miRNA in day 0 when compared to day 10, p-adjusted < 0.05. (C) Heatmap of the 93 significant miRNA over-expressed in day 0 when compared to day 10, p-adjusted < 0.05. (D) and (E) Biological networks of differentially expressed miRNA. In blue and red, under and over-expressed miRNA, respectively. Shadowed in grey are molecules related to miRNA, as displayed on the legend. Lines represent different relationships between the molecules and miRNA.

