Figure 4.
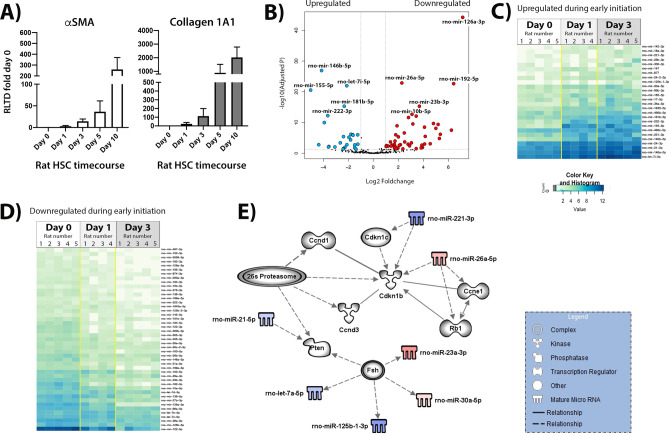
Differential expression of rat HSC activation during the initiation stage. (A) Quantitative PCR carried out on time-course cDNA isolated from of rat HSC preps used in the study showing αSMA transcript levels in left panel and Collagen1A1 in right panel. (B) Volcano plot of the comparison between the quiescent HSC (day 0, n = 5) and day 3 HSC (initiation of activation, day 3, n = 5). In blue—differentially under-expressed miRNA in day 0; in red—differentially over-expressed miRNA in day 0 (p-adjusted < 0.05 and foldchange > 1). (C) Heatmap of the 26 significant under-expressed miRNA in day 0 when compared to day 3, p-adjusted < 0.05. (D) Heatmap of the 45 significant miRNA over-expressed in day 0 when compared to day 3, p-adjusted < 0.05. (E) Biological networks of the differentially expressed miRNA. In blue and red, under and over-expressed miRNA, respectively. Shadowed in grey are molecules related to miRNA, as displayed on the legend. Lines represent different relationships between the molecules and miRNA.

