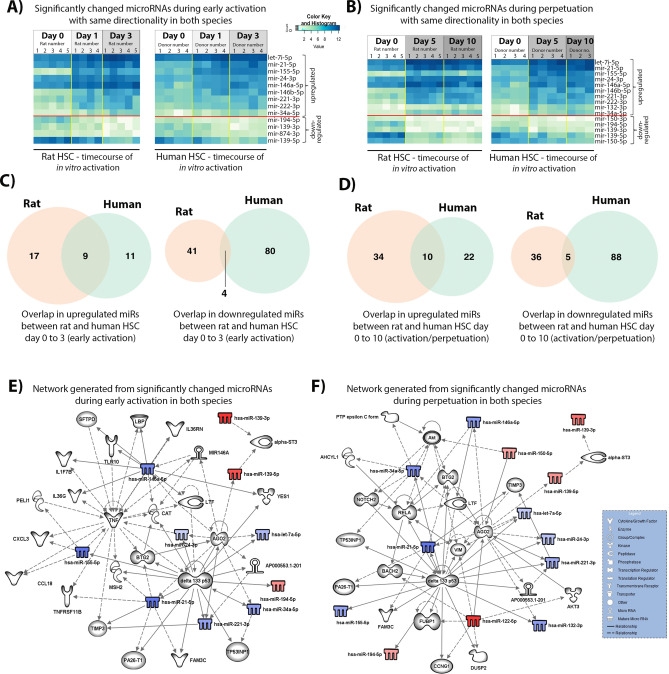
Figure 6.
Significantly different miRNA with the same directionality of expression change in both rat and human species. (A) Heatmaps of the significantly changed miRNA during the initiation stage of HSC activation in rat (left) and human (right). (B) Heatmaps of the significantly changed miRNA during the perpetuation stage in rat (left) and human (right). (C) Venn diagram showing the number of significantly upregulated (left) or downregulated (right) miRs during the initiation stage of HSC activation in rat and human. (D) Venn diagram showing the number of significantly upregulated (left) or downregulated (right) miRs during the perpetuation/full activation stage of HSC activation in rat and human. (E) Biological network of significantly differentially expressed miRNA with the same directionality in both species during the early stages of HSC activation. In blue and red, under and over-expressed miRNA, respectively. Shadowed in grey are molecules related to miRNA, as displayed on the legend. Lines represent different relationships between the molecules and miRNA. (F) Biological network of significantly differentially expressed miRNA with the same directionality in both species during the perpetuation of HSC activation. In blue and red, under and over-expressed miRNA, respectively. Shadowed in grey are molecules related to miRNA, as displayed on the legend. Lines represent different relationships between the molecules and miRNA. Networks were generated using miRNA from the overlapping between rat and human, however I am not sure how to explain in a fig legend).

