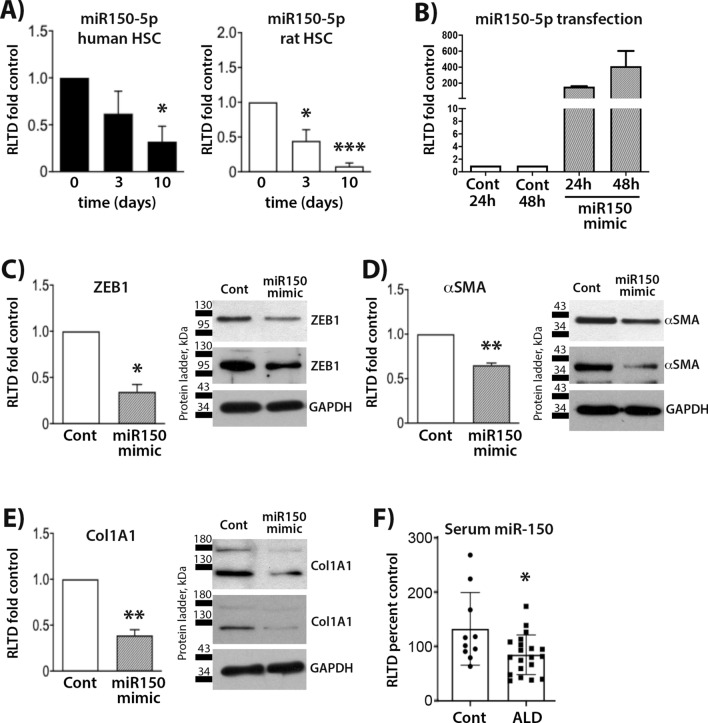
Figure 7.
miR150 mimic decreases ZEB1, Col1A1 and αSMA expression in rat HSC. (A) miR150-5p expression levels in human HSC (left) and rat HSC (right) as quantified by qPCR (both n = 4). (B) miR150-5p expression levels in miR150 mimic transfected rat HSC as quantified by qPCR. Rat HSC were transfected with miR150 mimic (n = 3), expression levels of ZEB1 (C, left panel), αSMA (D, left panel) and Col1A1 (E, left panel) were quantified by qPCR and immunoblotted (C, right panel, D, right panel and E, right panel, respectively). (F) Serum of patients with advanced fibrosis due to ALD (n = 20) and healthy controls (n = 10) was collected and levels of miR150 quantified by qPCR. Statistical significance determined by Student’s t-test where * denotes p = 0.0168.

