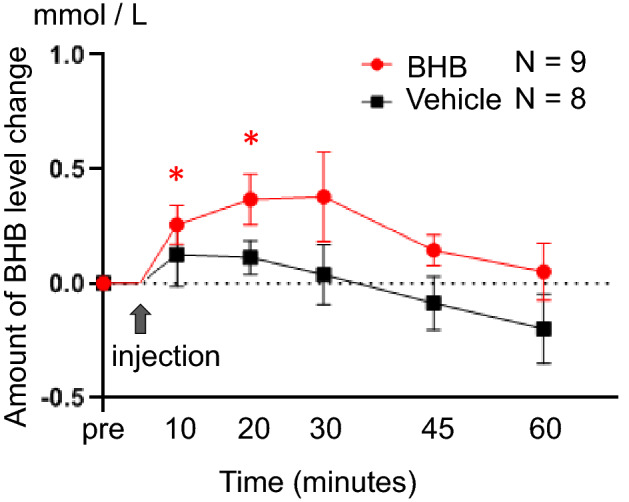
Figure 1.

Elevated levels of blood BHB after subcutaneous administration of BHB. Levels of blood BHB were measured after subcutaneous injection of BHB. BHB concentration significantly increased 10–20 min after injection compared to the one before BHB injection (paired t-test; 10 min: t = − 3.00, df = 8, p = 0.017, 20 min: t = − 3.32, df = 8, p = 0.011), and gradually decreased thereafter. BHB concentration did not significantly increase after PBS injection. The degree of change in BHB was calculated as follows: (the level of BHB at each time point)—(the level of pre-injection BHB). Data are shown using mean value and standard error. Paired t-test was performed to compare blood BHB level at pre-injection and at each time point. n = 9/BHB injection group and n = 8/Vehicle injection group. BHB: beta-hydroxybutyrate, * p < 0.05.
