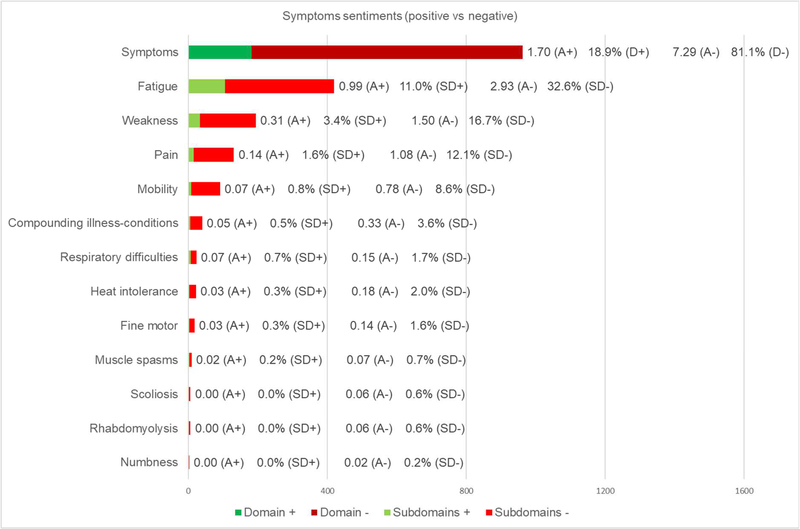
Fig. 2. Data transformation results for symptoms domain (N=107).
Total count of mentions (whole bar) with green colors reflecting positive comments and red colors reflecting negative comments, positive comments average per person (A+), overall positive comments percentage for this domain (D+), negative comments average per person (A-), negative comments percentage for this domain (D-), positive comments percentage for each subdomain (SD+), and negative comments percentage for each subdomain (SD-) are displayed

