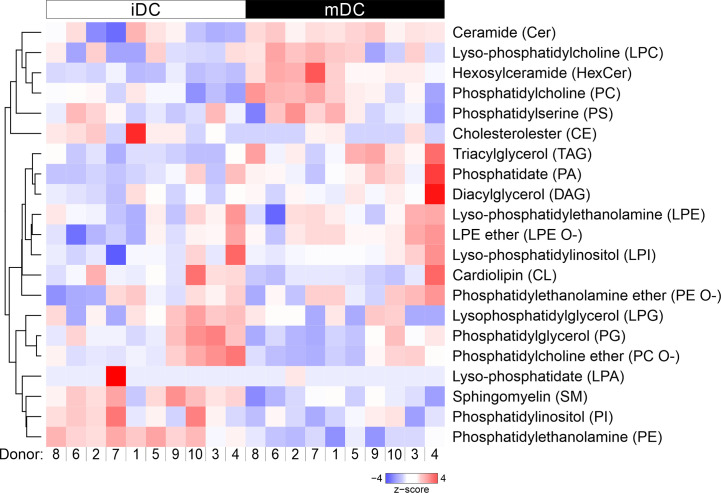
Figure 3.
Hierarchical clustering of lipid classes. Mass spectrometric analysis of total lipid composition of immature and mature moDCs was conducted. Here, lipid species were grouped into 20 different lipid classes, which resulted in the dendrogram on the left hand side. Each column represents one sample: white indicates immature moDCs, whereas black depicts mature moDCs. The order of donors follows the clustering from Figure 2C. The lipid amounts of cells have been normalized and scaled to a minimum of −4 and maximum of 4. Hierarchical clustering of lipid classes was performed using average linkage, where the distance between clusters has been calculated using Pearson’s correlation coefficient ρ (d=(1-ρ)/2).

