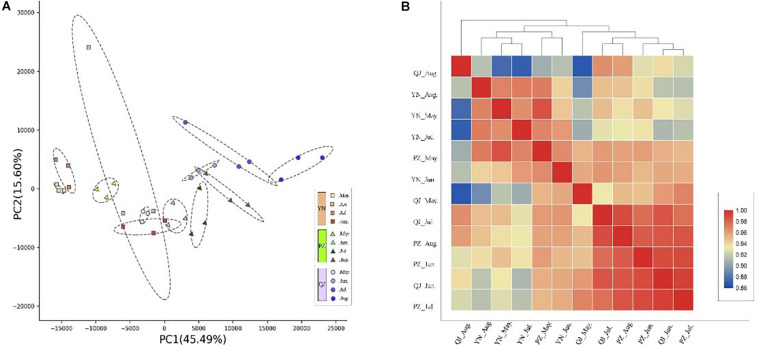
FIGURE 2.
Temporospatial differences in gene expression profile. (A) Principal component analysis (PCA) plot showing clustering of leaf transcriptomes at four developmental stages (temporal) under three different environments (spatial). Red squares, green triangles, and blue circles represent samples from YN, PZ, and QJ sites, respectively. The change in color from light to dark represents the four leaf development stages (May to August). (B) Pearson product-moment correlation coefficients and clusters of the RNA-seq data from leaf samples. The redder the rectangle, the stronger the correlation between the samples, whereas the bluer the rectangle, the weaker the correlation.

