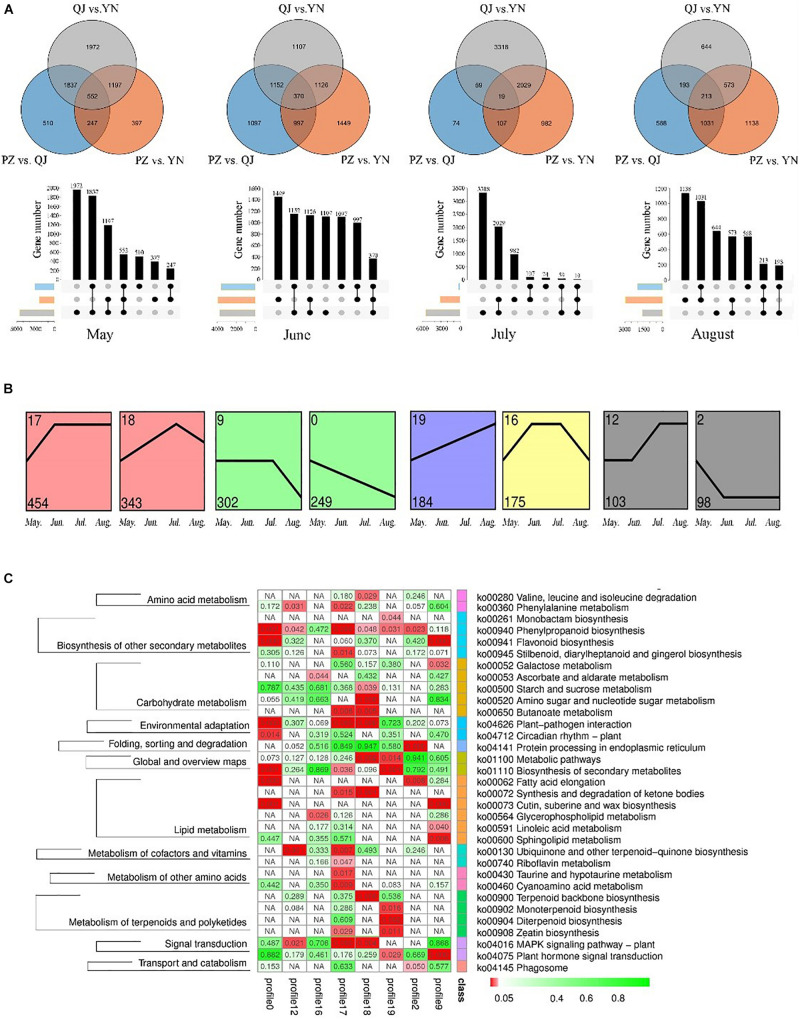
FIGURE 3.
Temporospatial expression pattern of differential expressed genes (DEGs). (A) Venn diagrams and column charts showing DEGs between samples from different growth environments (spatial) at four development stages (temporal). The gray circle/rectangle represents the difference between samples from YN and QJ; the blue one represents the difference between samples from PZ and QJ; the orange one represents the differences between the PZ and YN samples. (B) Profile blocks with a colored background are significant clusters of the P ≤ 0.05, and the same color represents that the profiles are the same cluster. (C) An enriched KEGG map shows significant pathways among the genes of eight profiles. The red rectangle represents a significant enrichment pathway (P < 0.05).

