FIGURE 4.
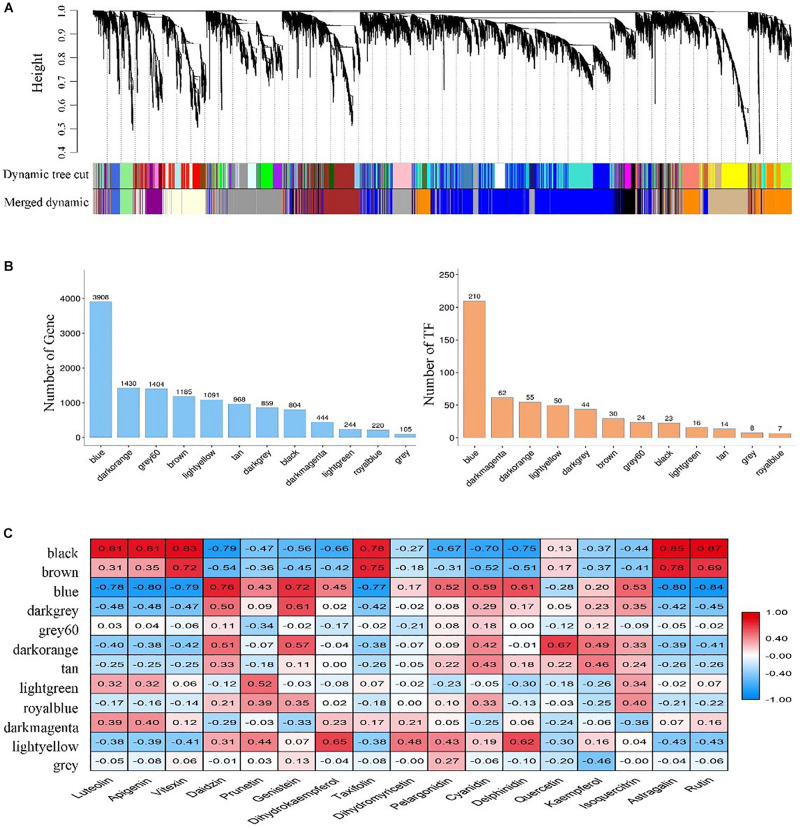
Identification and screening of gene co-expression modules. (A) Dendrogram showing modules identified by the weighted gene co-expression network analysis (WGCNA) and clustering dendrogram of expressed genes; (B) The number of genes and transcription factors (TFs) contained in each module; (C) Correlation coefficient between the abundance of flavonoids and module eigengenes presented with a color scale with red and blue representing positive and negative correlations, respectively.

