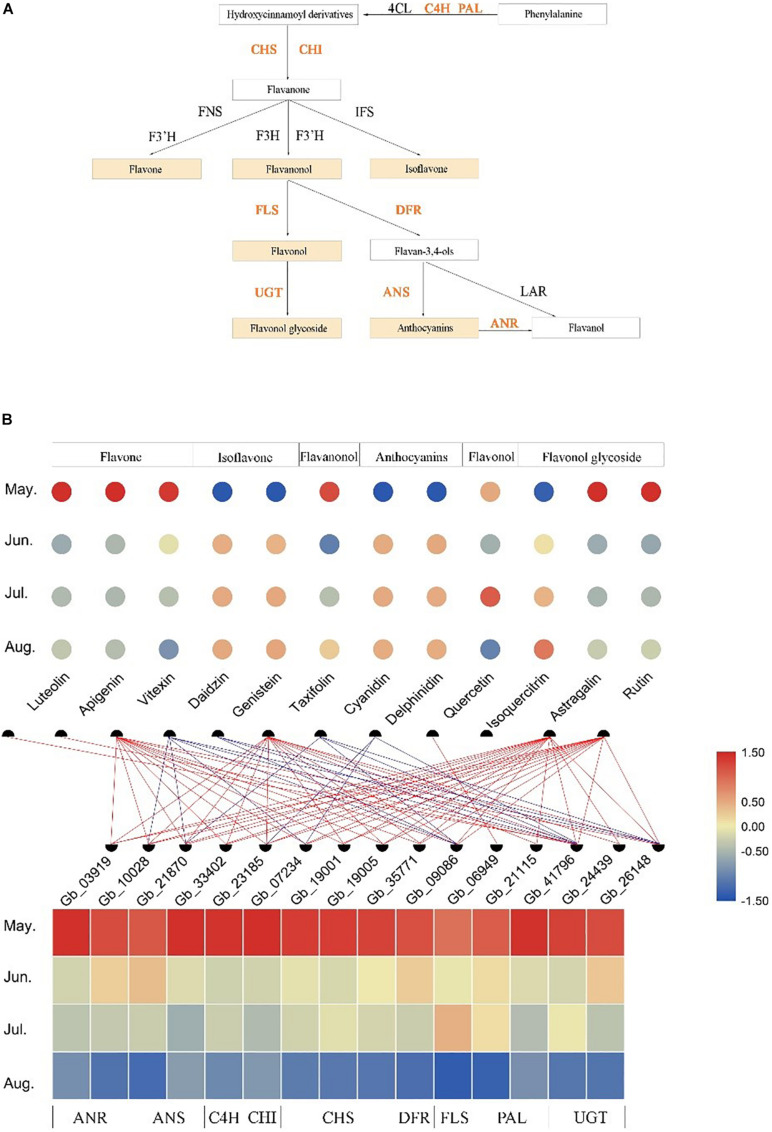
FIGURE 5.
Temporospatial expression patterns of flavonoid-related structural genes in different leaf developmental stages (temporal) and association analysis with the accumulation of several kinds of flavonoids. (A) The biosynthesis pathways of several kinds of flavonoids. (B) The accumulation patterns of 12 flavonoids and the expression patterns of 15 flavonoid-related structural genes in different growth stages and the association analysis between them. The change in color of circle/rectangle from red to blue represents a gradual decrease in the abundance of flavonoids/expression of structural genes. The red line represents the positive correlation between the expression of structural genes and the abundance of flavonoids, and the blue line represents the negative correlation between them (r > | 0.6|, P < 0.05).

