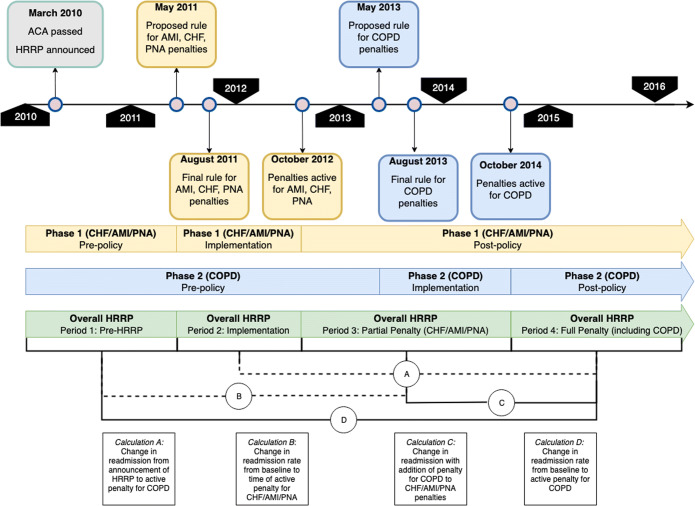
Figure 1.
Timeline for HRRP implementation and penalty periods with summary of calculations for interrupted time series analyses. Yellow bars delineate timeline for implementation and active penalties for CHF/AMI/PNA while blue bars delineate those for COPD. Green bars represent the aggregate time periods used for these analyses. Main calculations are lettered below where each calculation lettered corresponds to the periods in the boxes below the timeline.

