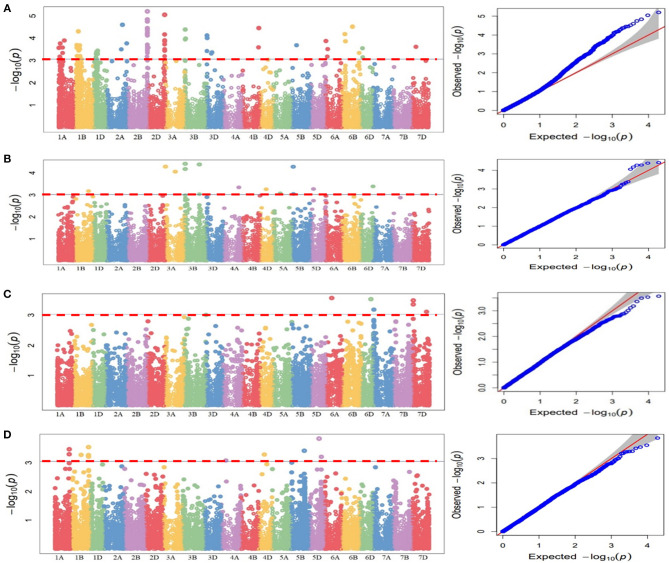
Figure 6.
Manhattan plots for statistical significance P-values across 21 wheat chromosomes for SNP markers associated with stripe rust four pathotypes. (A) 47S103, (B) 46S119, (C) 110S119, (D) 238S119 and Quantile-Quantile plots indicating the normality of data four pathotypes. Horizontal line represents significant MTAs at threshold of P < 0.001.

