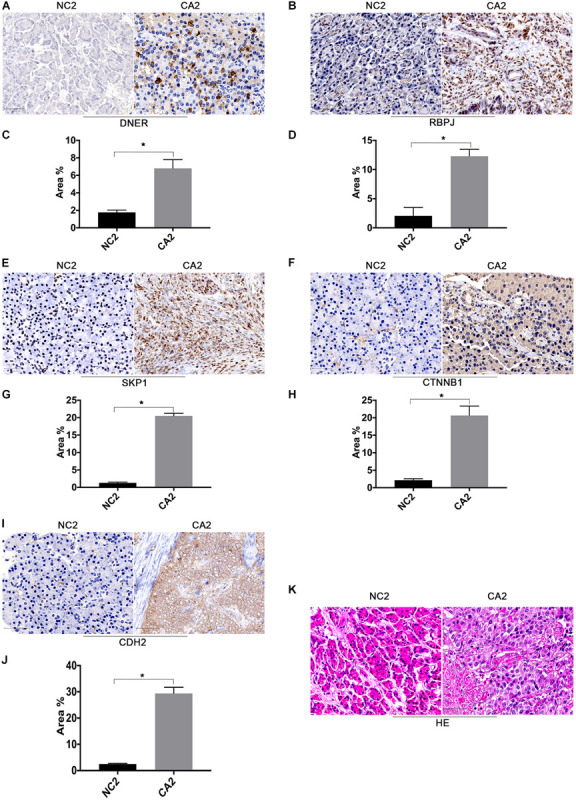
FIGURE 2.

Expression levels of DNER signaling pathway components in the clinical cohort. (A) Immunohistochemical staining of DNER in PanNEN tumor tissues compared with matched paratumor tissues. (B) Immunohistochemical staining of RBPJ in PanNEN tumor tissues compared with matched paratumor tissues. (C) Immunohistochemical staining analysis with IMAGE J was used to determine the protein level of DNER. (D) Immunohistochemical staining analysis with IMAGE J was used to determine the protein level of RBPJ. (E) Immunohistochemical staining of SKP1 in PanNEN tumor tissues compared with matched paratumor tissues. (F) Immunohistochemical staining of CTNNB1 in PanNEN tumor tissues compared with matched paratumor tissues. (G) Immunohistochemical staining analysis with IMAGE J was used to determine the protein level of SKP1. (H) Immunohistochemical staining analysis with IMAGE J was used to determine the protein level of CTNNB1. (I) Immunohistochemical staining analysis with IMAGE J was used to determine the protein level of CDH2. (J) Immunohistochemical staining analysis with IMAGE J was used to determine the protein level of CDH2. (K) Hematoxylin-eosin (HE) staining in PanNEN tumor tissues compared with matched paratumor tissues. (*P < 0.05 compared with paratumor tissues).
