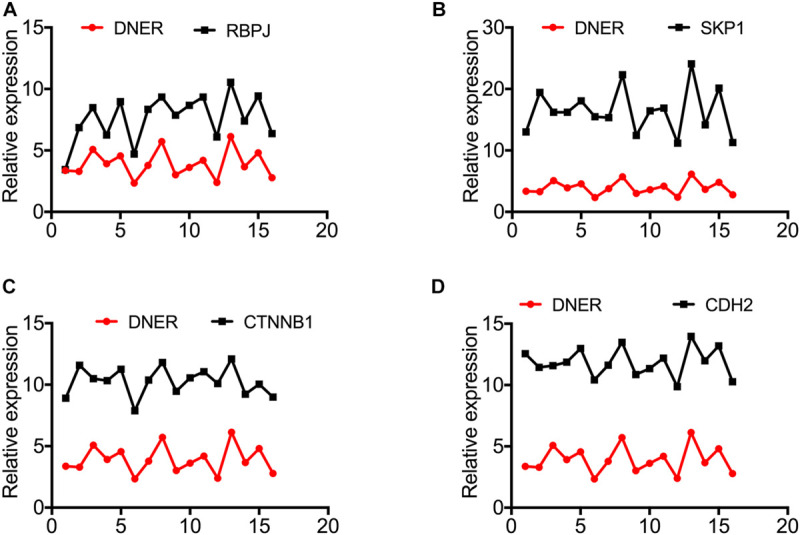
FIGURE 3.

The expression levels of RBPJ, SKP1, CTNNB1, and CDH2 are upregulated and positively correlate with DNER expression in PanNENs. (A) RBPJ protein expression compared with DNER protein expression in PanNENs (n = 15). (B) SKP1 protein expression compared with DNER protein expression in PanNENs (n = 15). (C) CTNNB1 protein expression compared with DNER protein expression in PanNENs (n = 15). (D) CDH2 protein expression compared with DNER protein expression in PanNENs (n = 15).
