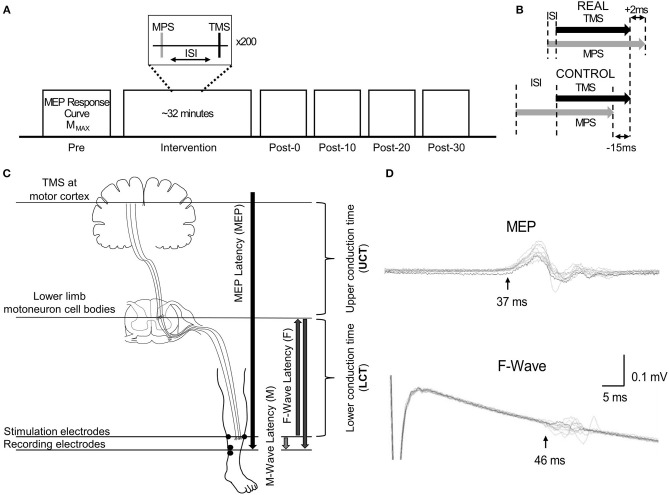
Figure 1.
(A) Representation of the experimental protocol, highlighting the pre- and post-intervention assessment measurements. (B) Schematic descriptions of ISI for the REAL and CONTROL conditions. (C) Schematic description of the conduction time measurements done prior to PAS intervention. The abbreviations of each measurement are shown in the brackets. The MPS electrodes and the SOL EMG electrodes placement are also shown. (D) Time courses of measured EMGs showing MEPs and F-waves for a representative participant recorded from the SOL. Onset latencies are shown by the black vertical arrow with the corresponding MEP and F-wave latency for this participant.

