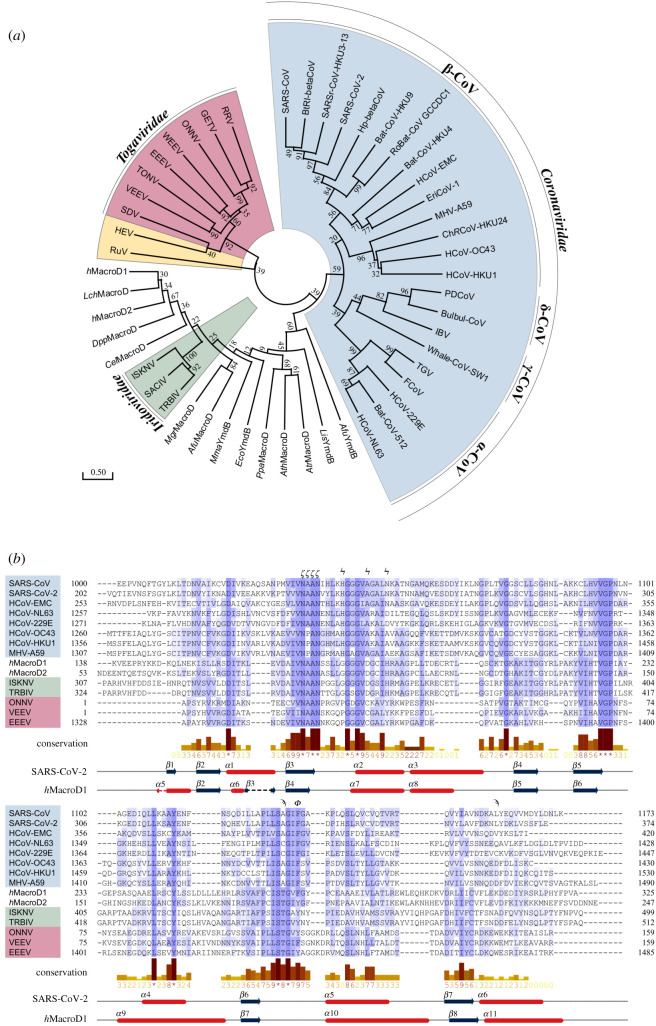
Figure 4.
Phylogenetic analysis of MacroD-like domains. (a) Evolutionary phylogenetic tree analysis of MacroD-like domain: The tree was constructed with amino acid sequences isolated from their whole protein context by multiple sequence alignment. The evolutionary history was inferred using the maximum-likelihood method under the LG model of amino acid substitution as implemented in MEGA X. The tree with the highest log likelihood (−10 025.59) is shown. The tree is drawn to scale, with branch lengths measured in the number of substitutions per site and the percentage of trees in which the associated taxa clustered together is shown next to the branches. Clusters of viral macrodomains are highlighted (Coronaviridae, blue; Iridoviridae, green; Togaviridae, red; hepatitis E virus (HEV) and Rubella virus (RuV), yellow). The alignment used to construct the tree can be found in electronic supplementary material, figure S2 and sequence information in electronic supplementary material, table S1. (b) Multiple sequence alignment of representative MacroD domains. The secondary structure of S2-MacroD and hMacroD1 as well as the residue conservation of physico-chemical properties [85] are given underneath the alignment. Residues important for ligand binding and catalysis are indicated above the alignment: catalytic (ϟ), active site arene (ϕ), NAAN motif (ϛ) and proximal ribose binding (ϡ). Note, that the structurally resolved, but evolutionary not conserved, N-terminal region of hMacroD1 was omitted for clarity. Viral sequences are highlighted using the colour scheme described in (a).

