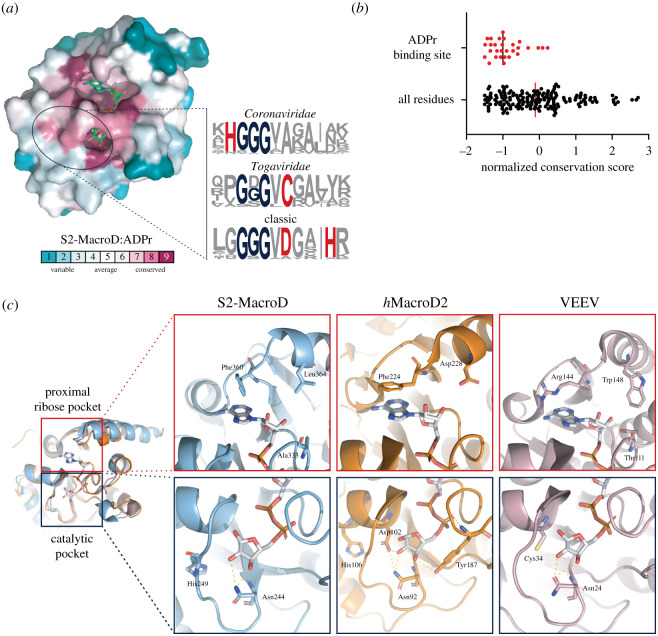
Figure 5.
Evolutionary differences in the proximal ribose and catalytic pocket. (a) Surface representation of residue conservation analysis for the MacroD-like class carried out using ConSurf server and mapped onto the S2-MacroD:ADPr structure. Colouring represents continuous conservation scores partitioned into nine bins for visualization. Sequence frequency logos of the catalytic loop region were generated using WebLogo [89]. Proposed catalytic residues are highlighted in red and the triple-glycine motif in blue. (b) Scatter plot of normalized continuous conservation scores of (a) comparing residues in the ADPr binding site with all residues in S2-MacroD. Lower values represent higher degree of conservation. The median of the distribution is indicated. (c) Ribbon-liquorice representation of key residues in the proximal ribose and catalytic pocket for S2-MacroD (blue, PDB 6Z5T), hMacroD2 (orange, PDB 4IQY) and VEEV (old pink, PDB 3GQO). ADPr is given in white and polar interaction as dotted lines.

