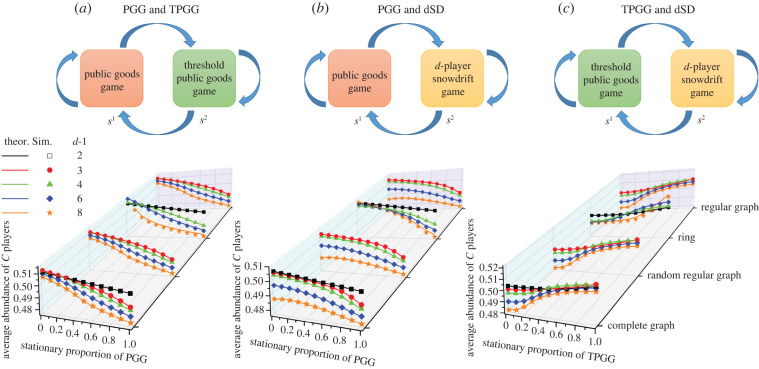
Figure 2.
Average abundance of C players in the population as a function of the stationary proportion of different games. In each homogeneous environmental state, s1 or s2, one of the three normal-form games, PGG, TPGG and dSD, is played. In the top row, three transition graphs are depicted to describe how the environment transits from one state to another. Corresponding to these three transition graphs, the bottom row shows the average abundance of C players in various population structures, based on theoretical calculations and simulations. All simulations are obtained by averaging 40 network realizations and 108 time steps after a transient time of 107, and θ is normalized per step to unify the magnitude. The feature vector ϕs,j,a is chosen to be the one-hot vector. Parameter values: N = 400, β = 0.01, , rs = 3 in the PGG while rs = 4 in the TPGG, in (b) while in (c), and T = [d/2] + 1 ([ · ] represents the integer part).

