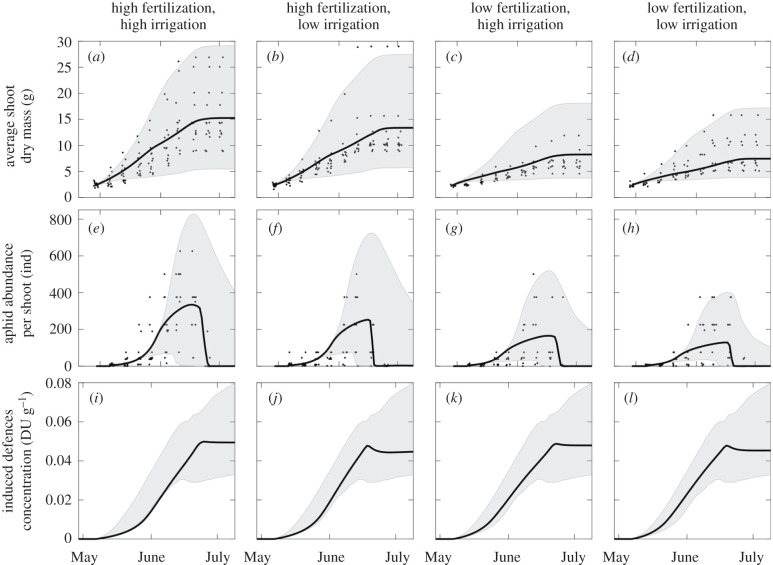
Figure 3.
Observed (black points) and predicted (black lines) values of average shoot dry mass (a–d), average aphid abundance per shoot (e–h) and induced defences concentration (i–l) under different fertilization and irrigation treatments: high fertilization and irrigation (a,e,i), high fertilization and low irrigation (b,f,j), low fertilization and high irrigation (c,g,k), low fertilization and irrigation (d,h,l). Grey shaded areas indicate the predicted 99% confidence bands.

