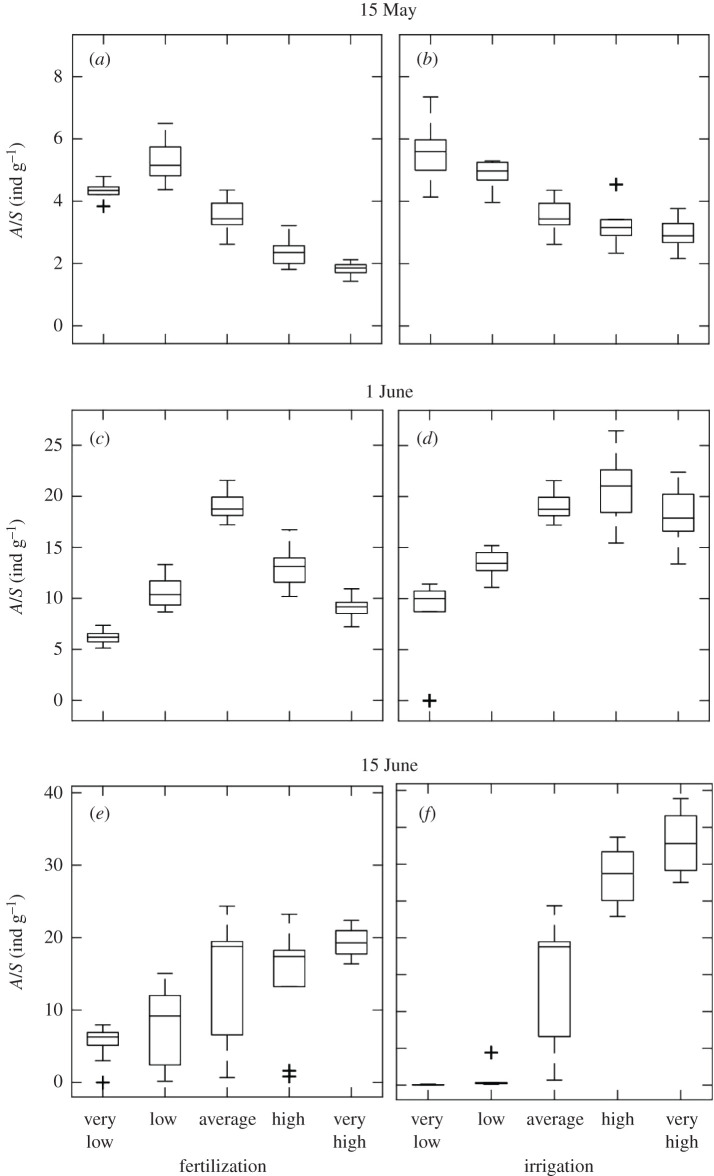
Figure 5.
Simulated effect of fertilization (a,c,e) and irrigation (b,d,f) on aphid density on 15 May, 1 June and 15 June. Boxes represent the first and third quartiles (25% and 75%) with a line inside indicating the median of 10 simulated replicates of each treatment. The whiskers extend ±1.5× the interquartile range (75th percentile—25th percentile) from the third and first quartiles. Values outside the whiskers are considered outliers and plotted individually using the ‘+’ symbol.

