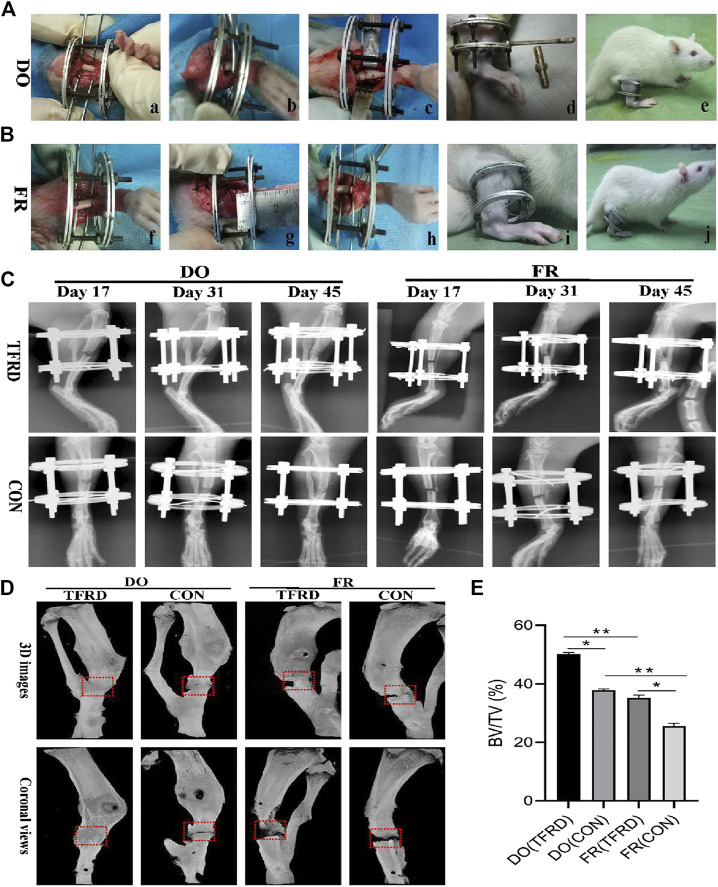
FIGURE 1.
Surgical procedures and imageological manifestations of DO and FR models. (A), (B) Creation of DO and FR models. a) tibia exposure and external fixator fixation; b) osteotomy; c) shortening and aligning the osteotomy ends; d) distraction procedure; e) consolidation stage; f) tibia exposure and external fixator fixation; g) osteotomy; h) not shortening the osteotomy ends; i) no distraction procedure; j) consolidation stage. (C) X-ray photographs obtained at 17, 31 and 45 days after surgery (n = 9 per group, n = 3 per time point). (D) Representative micro-CT images of bone regeneration in DO (TFRD) group, DO (CON) group, FR (TFRD) group and FR (CON) group at 45 days after surgery. Red dotted boxes indicate region of interest (ROI), representing bone defect areas. (E) Quantification of bone tissue volume/total tissue volume (BV/TV) in the four groups. Significant difference is present when p < 0.05, displayed with an asterisk, or p < 0.01, displayed with two asterisks, while NS represents no significant difference.

