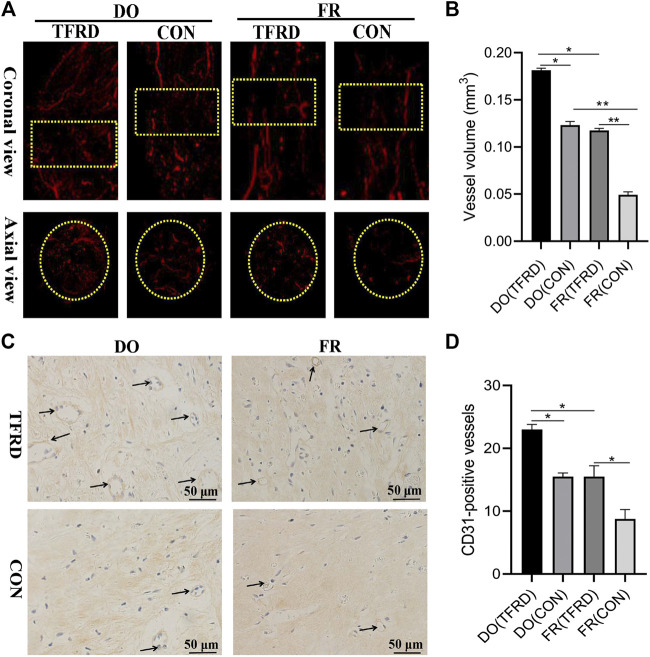
FIGURE 2.
Effects of TFRD on vessel formation in rats of DO and FR models. (A) Representative angiographic images of four groups at 17 days after surgery in both coronal (top panel) and axial (lower panel) views. Yellow dotted boxes indicate region of interest (ROI) (n = 3 per group). (B) Quantification of the vessel volume at (A). (C) CD31 expression inside the bone fracture or distraction regions of four groups obtained by immunohistochemistry staining at 17 days after surgery (n = 3 per group). (D) Quantification of CD31-positive vessels in bone fracture or distraction zone. Black arrows indicate CD31-positive vessels. The data are expressed as the mean ± SEM of three independent experiments, *p < 0.05, **p < 0.01, NS: not significant.

