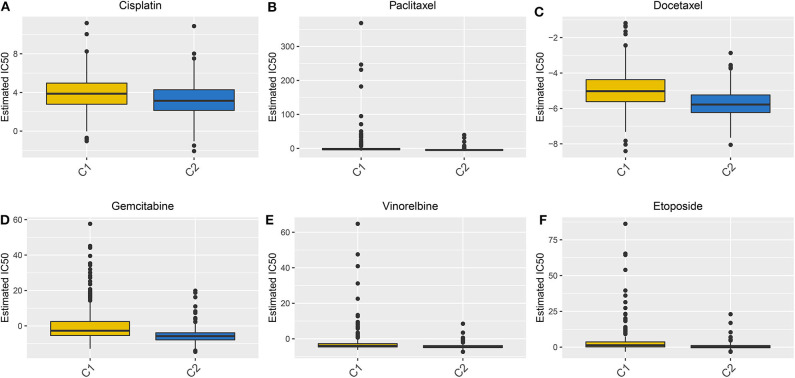
Figure 8.
Box plots showing the differences in estimated IC50 values of six chemotherapy drugs between the two LUAD clusters. (A) Cisplatin. (B) Paclitaxel. (C) Docetaxel. (D) Gemcitabine. (E) Vinorelbine. (F) Etoposide. Each dot is indicative of the estimated IC50 value in each LUAD sample. The higher the sensitivity to the drug, the lower the IC50 value.

