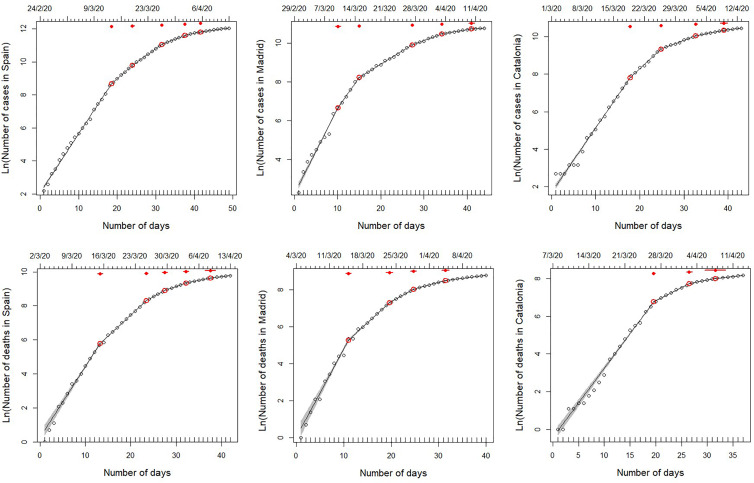
Fig. 1.
Segmented regressions fitted on the total number of cases detected in Spain and the two autonomous regions hosting its two largest cities (Madrid and Catalonia) from 25 February 2020 to 13 April 2020. Within this period, data series varies among variables and regions, since they start on the first day with >10 cases or >1 death (see upper x-axis for initial date). Lines show the best fit, as specified in Table 1 (see also Tables S2–S3). Red dots indicate breaking points of the best fit, with 95% confidence intervals (red lines). Note that, although the segmented analyses were performed on non-transformed data, we use a log-transformed y-axis for clarity.

