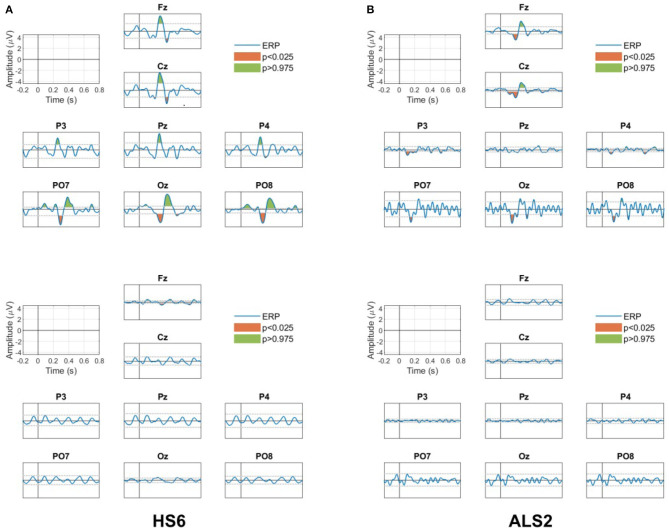
Figure 9.
ERP responses for all channels for the target (upper panels) and non-target (bottom panels) conditions for (A) the healthy participant HS6 and (B) the patient ALS2. Green and red areas in the ERP for the target condition are the positive and negative peaks that presented significant differences (p < 0.05, two tail test) with the estimated PDF of the baseline period. No significant peaks are observed in the ERP for the non-target condition.

