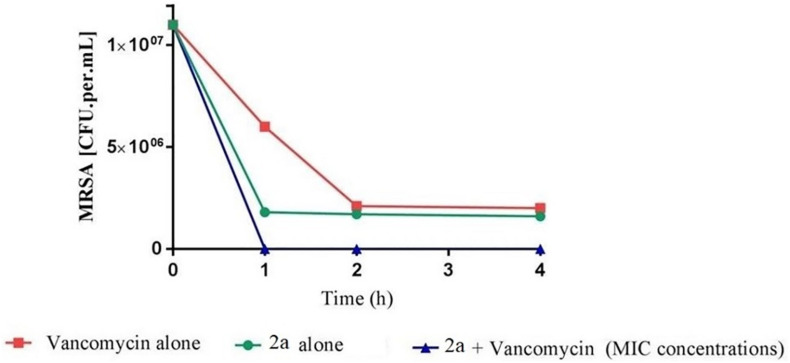
FIGURE 10.
Time-kill curve study of combinations of vancomycin and 2a versus MRSA at drug exposure in MIC concentrations. The curve displays the mean CFU for duplicate samples and represents data from two independent experiments. Twelve doubling dilutions are plotted, the highest concentration (black line) corresponds to 16 × MIC. Growth in absence of antimicrobial is drawn in red. The compound was added at time point 0 and monitored until 24 h. The limit of detection in the assay was 100 CFU mL–1.

