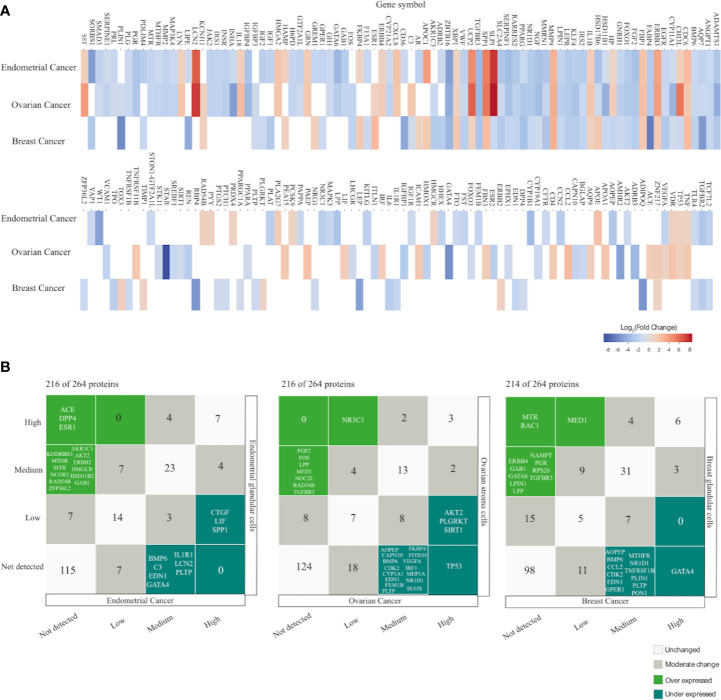
Figure 5.
Gene and protein expression profiling of PCOS related genes (PRG) in endometrial, ovarian and breast cancer compared with normal tissue. (A) Heatmap displays the differential expressed genes with |Log2FC| = 1, FDR < 0.001 from GEPIA database. Empty spaces indicate absence of differential expression. (B) Correlation plot comparing immunohistochemical protein expression profile between cancer samples and healthy tissue according to The Human Protein Atlas (HPA) in each cancer type.

