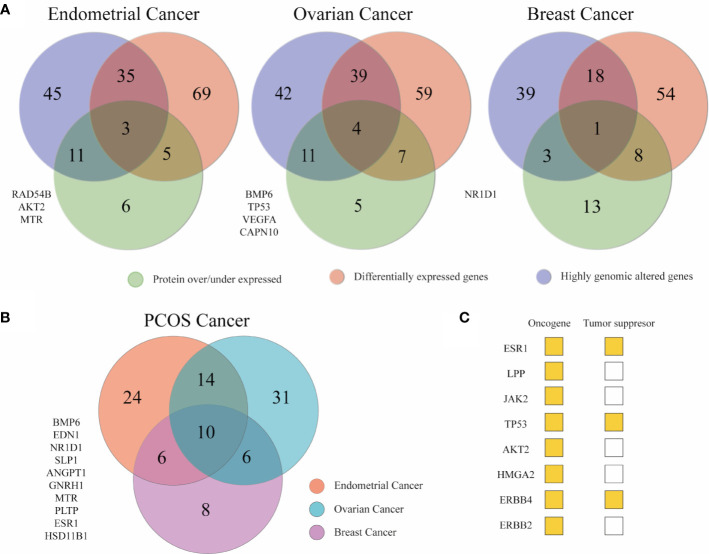
Figure 6.
Key genes between gynecological cancer and PCOS. (A) Venn diagrams depicting the number of unique and shared associated PCOS across the three omics approaches. The list of genes at the left are the genes that appeared in the three omics approaches in each cancer type. (B) The Venn diagram shows PCOS related genes altered in at least two omics approaches in breast and gynecological cancers to stablish a relationship between the syndrome and cancer genetics.

