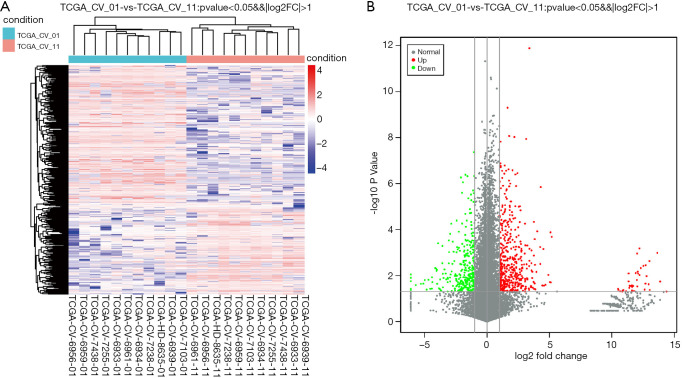
Figure 1.
OTSCC DEGs in TCGA dataset. (A) Heat map hierarchical-clustering shows 581 DEGs in tumor specimens (TCGA-CV-01) compared with non-tumor samples (TCGA-CV-11). Data are provided in a matrix format, in which rows represent individual genes and columns represent each patient. Each cell in the matrix represents the expression level of a gene featured in an individual patient. (B) Volcano plot illustrating DEGs. Vertical lines denote FC values. The right vertical line corresponds to changes of log2FC >1, while the left vertical line corresponds to changes of log2FC <−1. The horizontal line marks a −log10 P value of 0.05. DEGs, differentially expressed genes; OTSCC, oral tongue squamous cell carcinoma.

