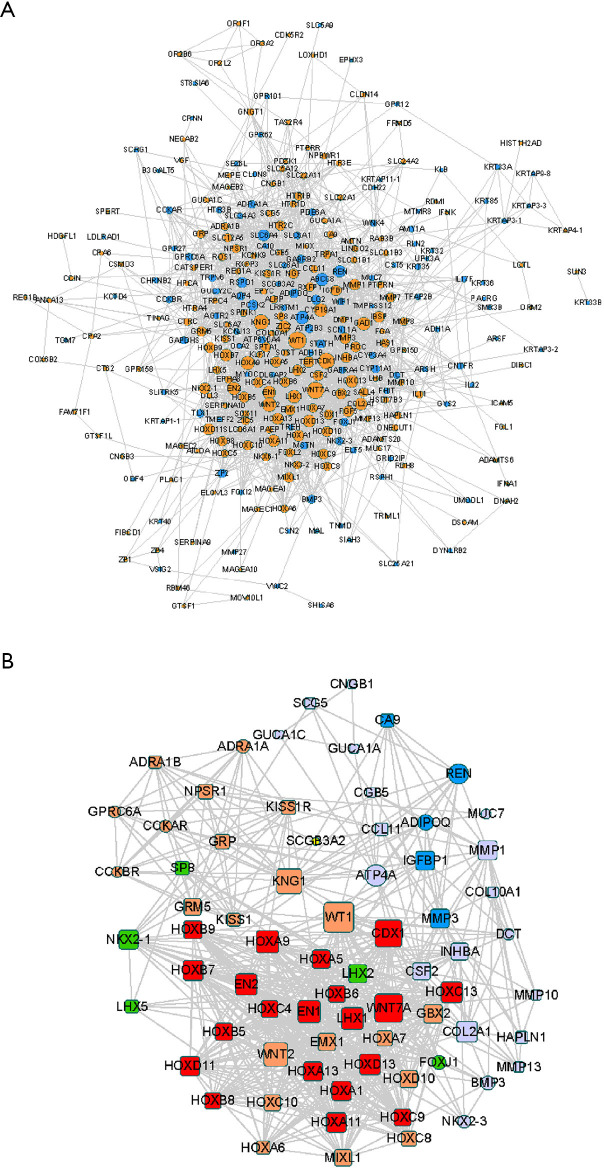
Figure 4.
PPI network construction. (A) PPI network of all DEGs. Yellow and blue nodes represent upregulated and downregulated DEGs, respectively. (B) The top five modules extracted by MCODE. Square and round shapes represent downregulated and upregulated DEGs, respectively. The different colors represent five different Mcode_clusters: cluster 1, red; cluster 2, orange; cluster 3, green; cluster 4, purple; and cluster 5, blue. PPI, protein-protein interaction; DEGs, differentially expressed genes.

